
The Risk-Reward Ratio, R-Multiple and Trade Expectancy
Trading is a bit like going to war. Great emphasis is placed on planning and executing strategic ideas that will lead to victory – on the battlefield and in the markets. Thus, probabilistic thinking and controlling emotions, managing trades with a thorough knowledge of past statistics and knowing what to expect, does not only create confidence in a trader but will likely make him successful. Many articles have been written about the risk-reward ratio, the R-multiple (=risk) and the importance of trade expectancy and money management in general. But what are the central pillars of a solid risk-adjusted trading approach?
The R-Multiple
and
Trade Expectancy
and
Risk-Reward Ratio
R simply put, is a measure of risk. It defines the initial stop loss and measures the potential reward. Thus, the risk-reward ratio. Usually, the loss on a trade does not exceed 1R, whereas the reward is a multiple thereof. When creating trading strategies, traders need a sufficient size of a dataset and a big enough number of samples to define the historical R. A statistical sample anywhere from 20-30 is large enough to be considered statistically viable. Let’s take a set with the following Rs:
Losers
22 x 1R loss
Winners
3 x 5R, 3 x 4R, 2 x 3R
Trade Expectancy
So, we have 22 losers and 8 winners out of a sample of 30 trades. Notice, how the size of the losers is kept constant while winners have varying R amounts. If we add up all Rs, on the losing side we have 22R and on the winning side 33R. If we divide the winners by the losers, we come to the amount that the system will make over a long time. This is the Trade Expectancy:
33R / 22R = 1.5R
Every Dollar at risk will make 1.5 on that risk. If you risk 100.000, you are expected to make 150.000 on that amount, over a long time.
Dr. Tharp states in his book “Financial Trading Through Electronic Day Trading”
The golden rule of trading is to keep losses at a level of 1 R as often as possible and to make profits that are high-R multiples.
You do not have to read the book. Just remember his quote. Every time you take a trade, think about the risk you are about to take, think about the R. Ask yourself if the potential reward is worth the risk. Remember to think in terms of risk-reward-ratios, each and every time you are putting on a new trade.
Risk-Reward Ratio
The risk-reward ratio is one of the most widely-used risk ratios. It looks at the potential reward and the potential loss of a trade and puts them in relation to each other. The risk is defined by the size of the stop loss. Whereas the reward is defined by the size of the take profit – or the exit point of the transaction. In forex, risk and reward are typically looked at in terms of pips. If the stop loss on a trade is 10 pips, and the take profit is 50 pips, the risk-reward ratio is 1:5. You are risking 1 dollar to make 5 dollars. A very favorable risk-reward ratio.
Determining Risk
So how do you determine the risk on a trade? Before entering a trade, you need to have a point at which you will get out – if the trade goes against you. This point is the risk you are taking, your expected loss. Use this point (in pips or points) to size your position. For example, if you enter a trade in EUR/USD at 1.2010 and have a stop loss of 10 pips, you will exit your trade once the price drops below 1.2000. If your take profit is fixed at 1.2060, your potential reward is 50 pips, that is 5R.
To sum up this paragraph, expectancy tells a trader whether he can expect to be profitable over the long run, whether he will make a net profit over a large sample of trades. If the total amount of money made is greater than the amount lost, the trader has a system with a positive expectancy. If the total amount of money lost is greater than the amount won, the system has a negative expectancy and the trader loses money over the long run.
Net expectancy on a big statistical set can give traders great confidence. Thus, Expectancy is a great metric to measure potential profitability across different markets and trading strategies. Not seldom, strategies used in the currency markets can be transferred to commodity or equity markets (given that the metrics are positive). The more traders understand risk and risk metrics, the more emotionally detached they will feel and the better they will trade.
Manage the system professionally
Traders often get fooled by the frequency of losing trades. For example, a trader can lose 20 times in a row and still be profitable. As long as his average winning trade is bigger than his average losing trade – by a big enough factor.
If the numbers and risk metrics show positive results, the system still needs to be managed professionally. The fewer criteria you have, the easier – and often better – it is to be managed. You always need to be clear about trade entry criteria and setups, have exit rules in place and manage the trades according to your rules. Try to always follow your rules. If you don’t, punish yourself.
Trade like a casino
As a trader, you compete against one of the brightest minds in the world and against computer algorithms that are not prone to emotional outfalls. That is why you must be extremely meticulous in the way you log your trades. Practice makes perfect. So, practice your setups and trade according to your rules. If your system is viable, winning trades will present themselves, losses will come, sometimes many losses in a row. Do not get demotivated by losses. You need to take control of your emotions. Be a good risk manager and focus on reducing risk as much as possible. In the long run, consistency is what counts and hitting singles and doubles will add up, while few homer uns will come from time to time.
Trade like a casino: place many small bets and rely on statistics; probability will win in the long run.
Do not obsess about the last trade but see the trade as a piece in a series of trades. Take every setup of your system – each and every time. Losing often but little and winning bigger amounts than you lose will give you confidence over time. Develop your own rules and stick to them and do not let your subconscious fear and greed get in the way of your trading. Detach from winning and losing money and your human emotions. Be a robot. Be a casino.

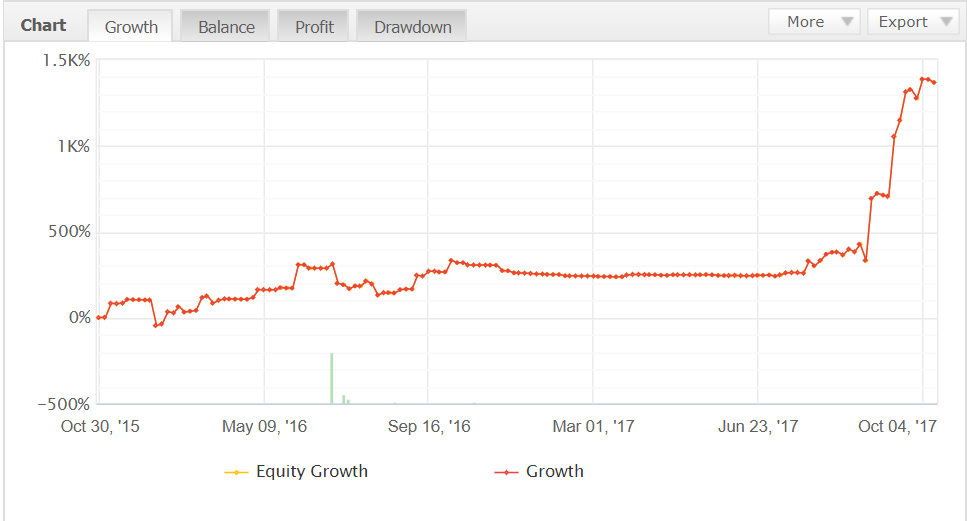
Look at these trade statistics. Do they reveal a lot about the success of the strategy? Look, how the profitability is in the lower third of the scale, and only 25% of the longs are won and 42% of the shorts. If you are an inexperienced trader, you will give too much weight to this very profitability. You will also not like the idea of losing. But the fact is that especially momentum based and trend following strategies generally have a low profitability. That is, more losing than winning trades. Unfortunately, some people cannot grasp that. Still, as you can see above, the average winning trade is $48.73 and the average losing trade is $8.32. The best trade in Dollar terms is 614.97 while the worst trade is 192.18. The account is up about 1300%.

Average Profitability Per Trade
What matters is that your APPT comes up positive and that your overall profits are more than your overall losses.
Average Profitability Per Trade =
(Probability of Win x Average Win) – (Probability of Loss x Average Loss)
= average amount you can expect to win or lose per trade
Example 1:
- a statistical sample of 100 trades
- you win 20 and lose 80
- win rate is 20% or 0.2
- the probability of loss is 0.8
- average winning trade makes $1000
- average losing trade loses $500
In this scenario, the APPT is:
(0.2 x $1000) – (0.8 x $500) = -$200
The profit/loss ratio is 2:1 but still we have a negative APPT: for every trade you take, you will likely lose -$200.
Example 2:
- a statistical sample of 100 trades
- you win 50 and lose 80
- win rate is 50% or 0.5
- the probability of loss is 0.5
- average winning trade makes $1000
- average losing trade loses $500
In this scenario, the APPT is:
(0.5 x $1000) – (0.5 x $500) = $250
Eventually, you will make profits over time.