
Hey friends. It’s me, Andreas from MacroSpike and I’ve just finished a quick market analysis for the UK trade tomorrow morning at 04:30 EST. We’ll have the British CPI coming out and I can hardly wait for the numbers…Indeed, I am thrilled so much that I wrote this article. I need to show you some interesting things I found looking at the past charts of CPI numbers.
CPI data has a big impact on government bonds. The UK 10-Year GILT is the most liquid and most traded UK government certificate.
I went all the way back to July 2017 with my analysis. The data is simply amazing! Have a look…
18.07.2017
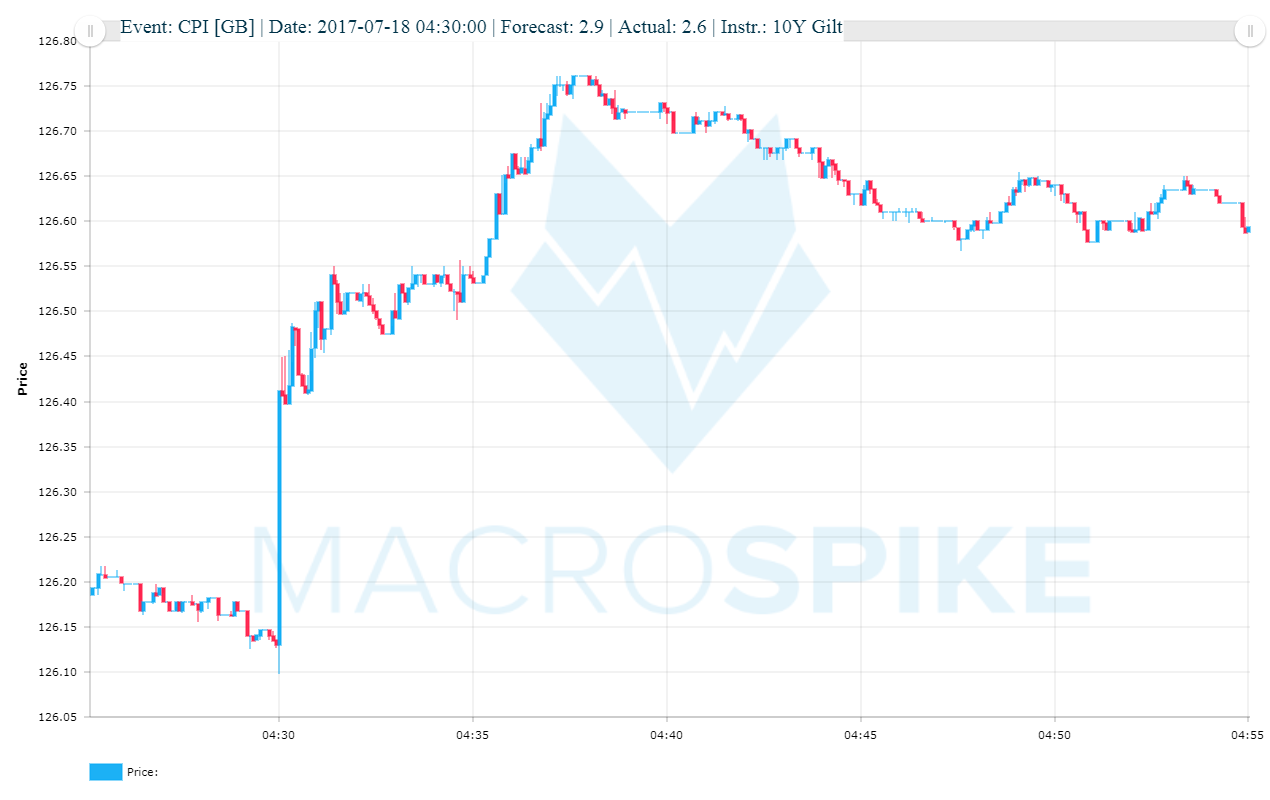
Economists forecasted a 2.9% reading for the UK consumer price inflation on a year on year basis. But, that is not what we got. The reading came out at 2.6%, a -0.3% miss. This is a huge deviation likely to happen once in a year. (According to our in-house statistics). I am having a flashback right now because I see the live chart right in front of me. GILTs spiked 30 points – and continued to advance over the following days. Here is the chart. 60 points within just 7 minutes!
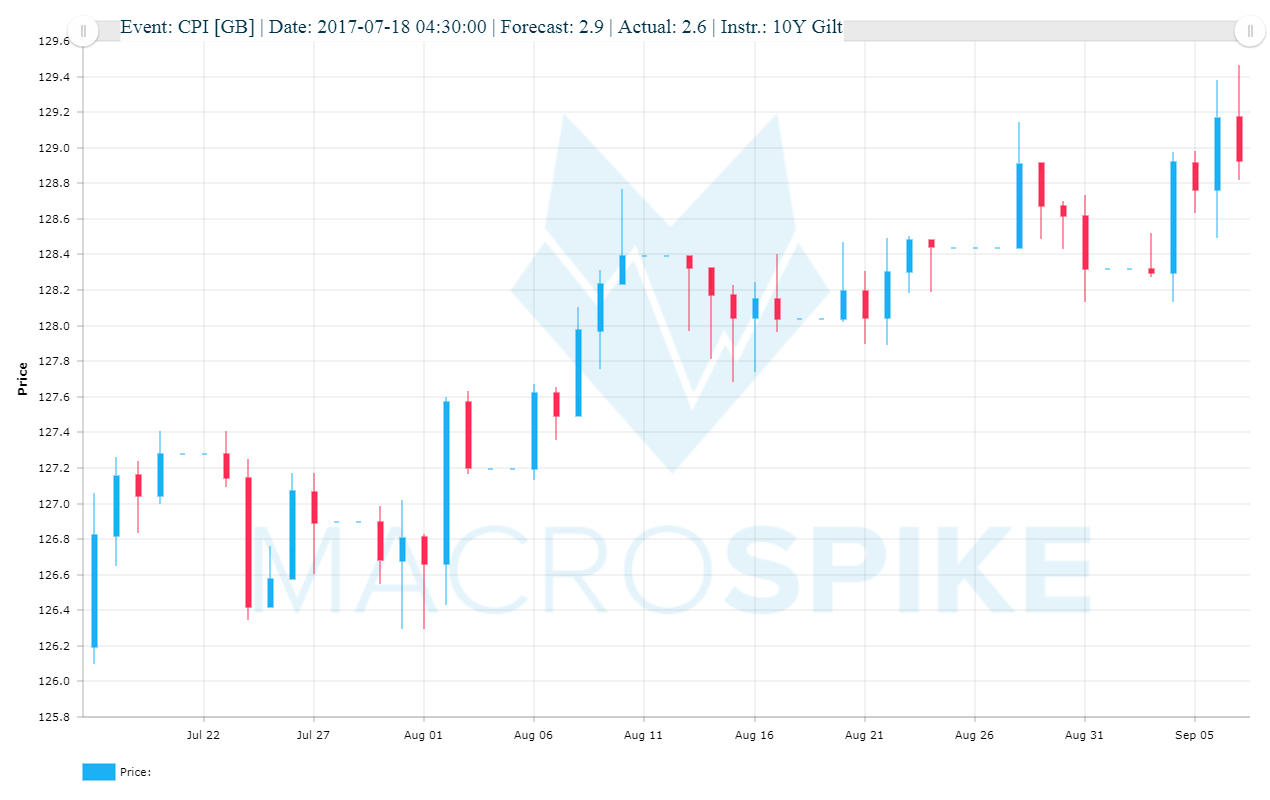
Here is what happened over the next days and weeks. The price went from 126.15 to 129.46 – a 2.6% increase. That is a huge move for government bonds.
15.08.2017
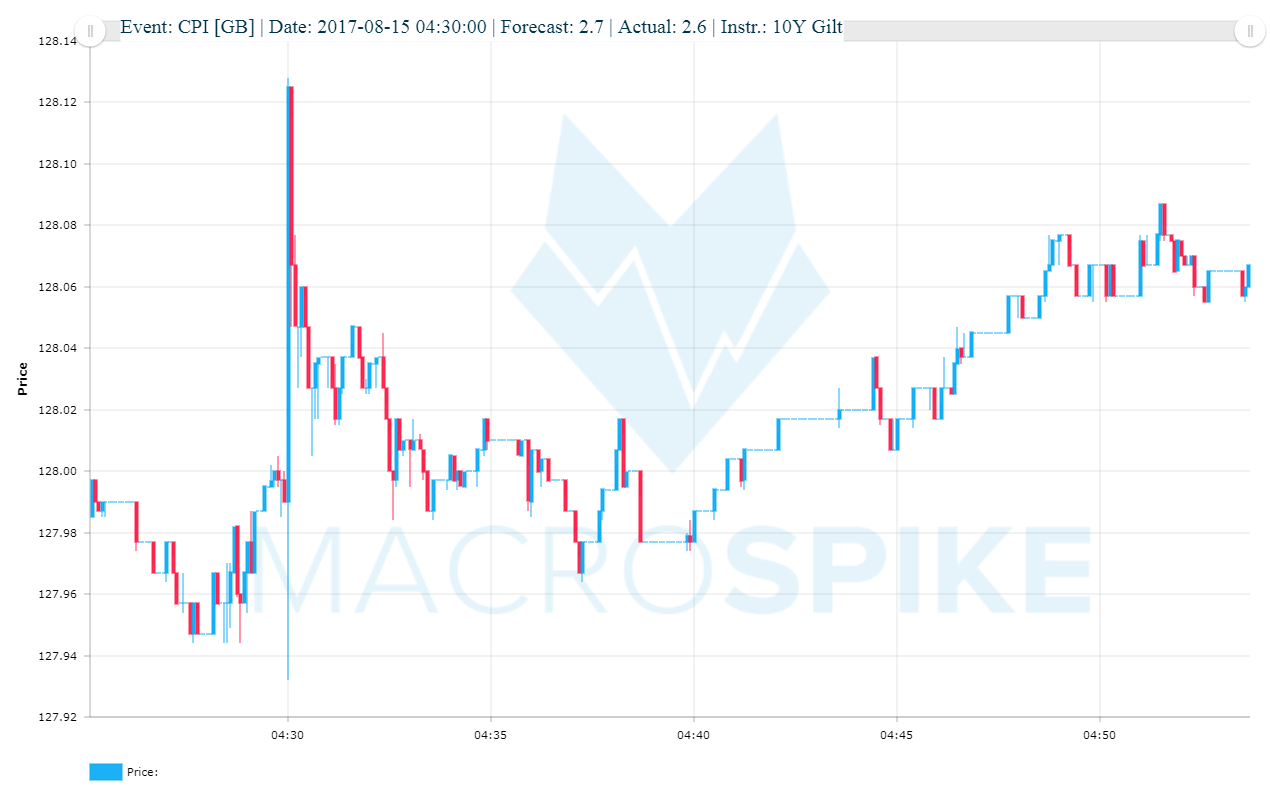
This was a dull report. The deviation from forecasts was -0.1 (2.7% forecast / 2.6% actual reading) and the market was spiking 12 points to the upside… and that was it!
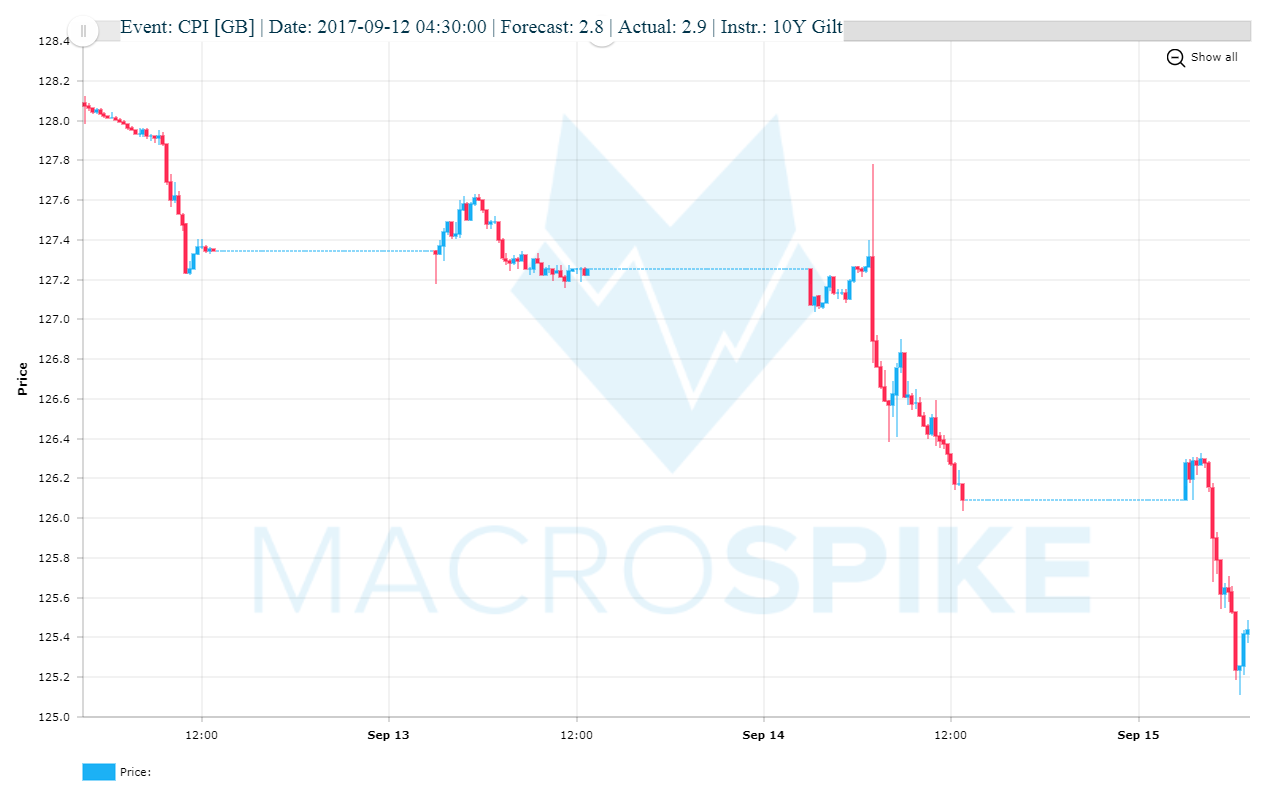
12.09.2017
Call it a mega move! In fact, if you took this signal, you could still be into the trade. This time, inflation was higher than expected (2.8% expected / 2.9% actual) and volatility was huge. GILTs spiked 10 points down within the first 2 seconds, slid down for 8 more points until retracing back to the 50% retracement level. From here on, GILTs got literally slaughtered. Trading at 121.40 at the writing of this article. More than 660 points. (-5.5%!)
14.11.2017
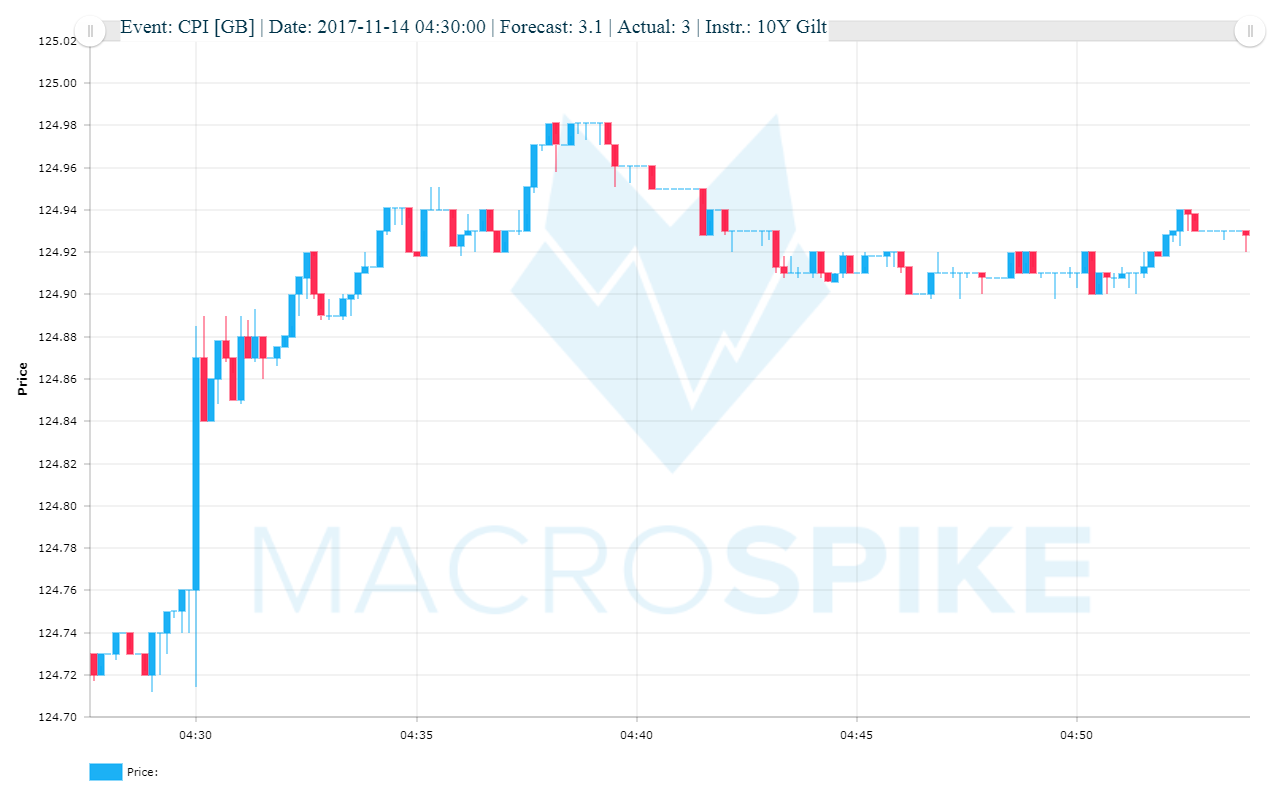
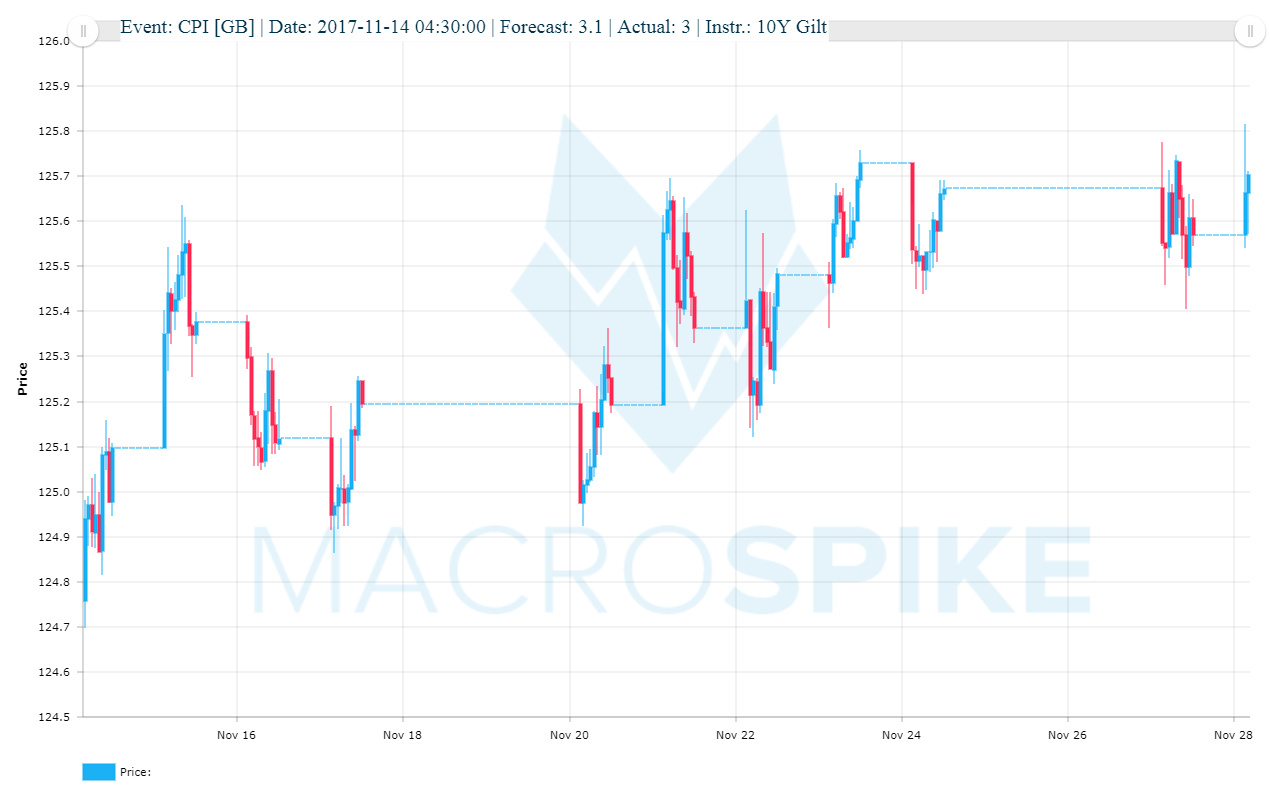
Forecast: 3.1%, Actual 3.0%, Deviation -0.1%. Spike from start to end 95 points. The initial spike was about 12 points, similar to the reaction in August and September. Hmm…Not bad at all. This was really low-risk.
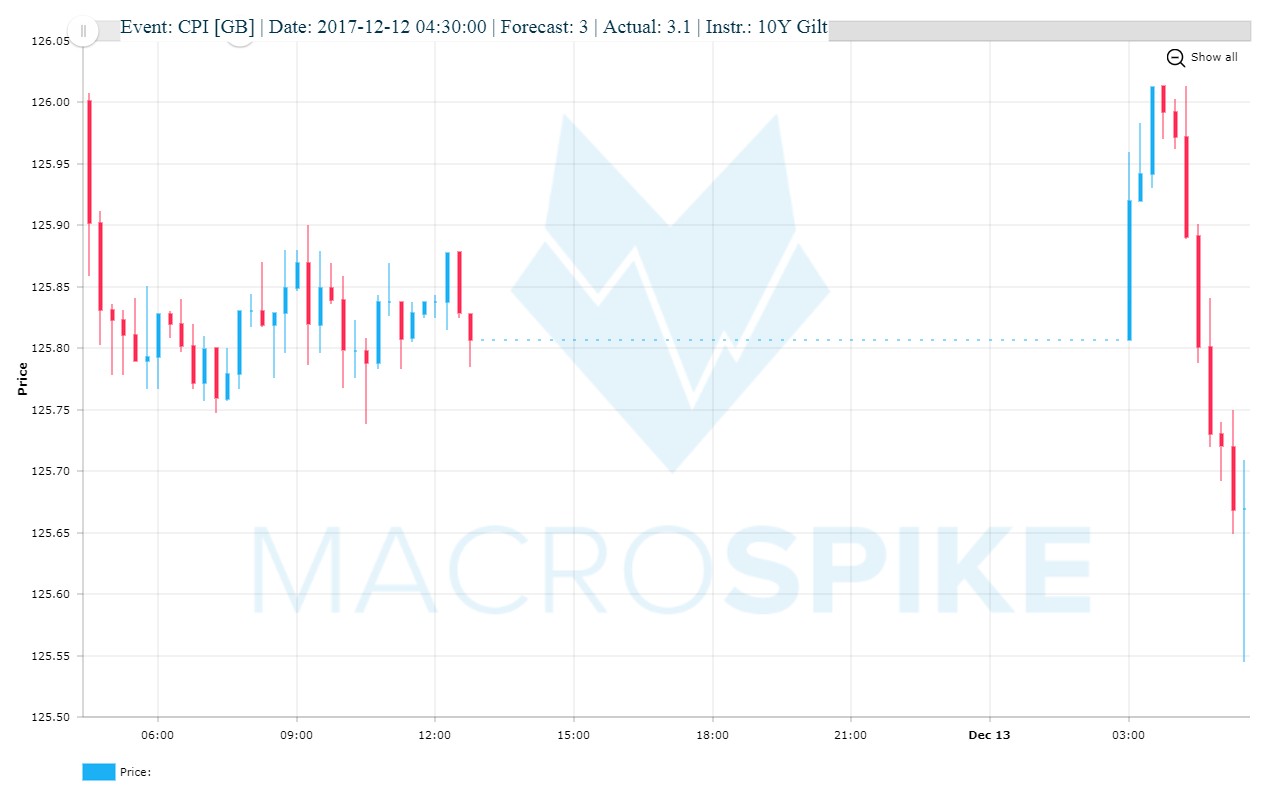
12.12.2017
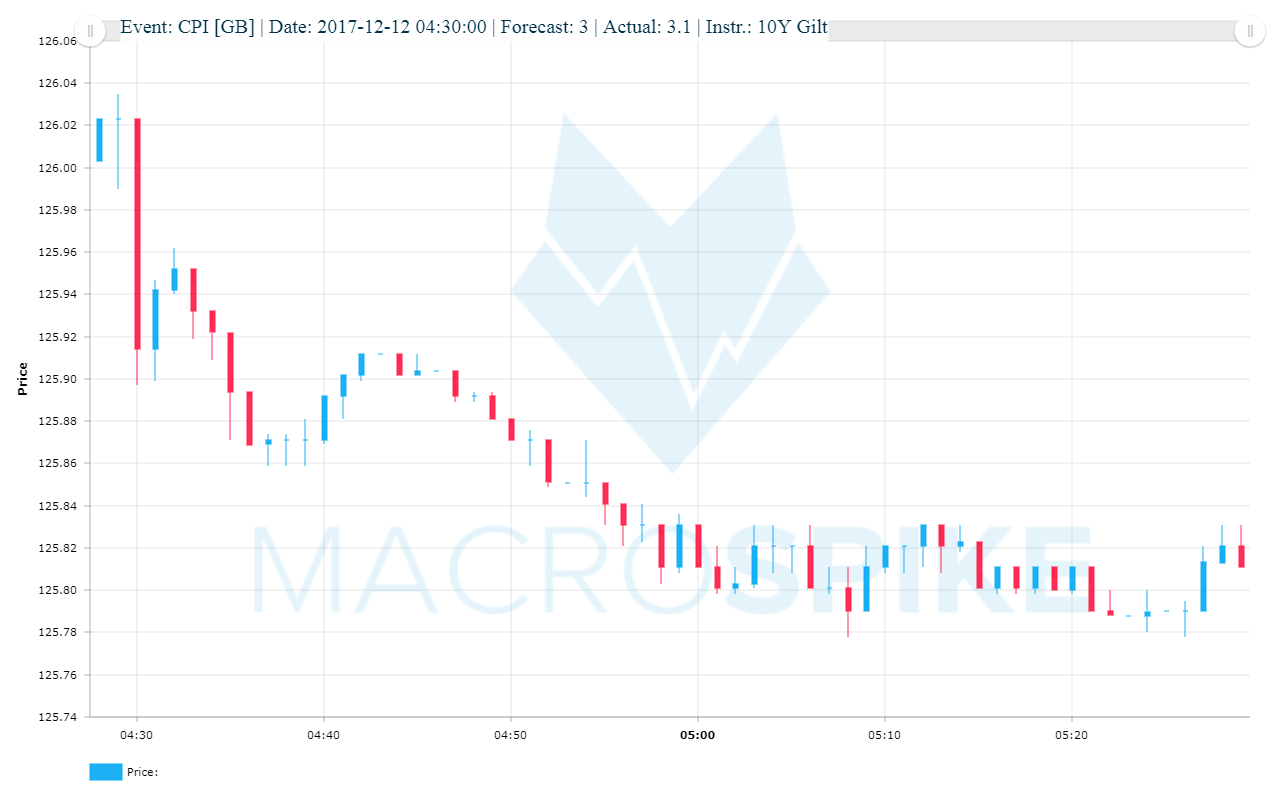
Deviation +0.1% (3.1% actual), and what seems to be the standard spike of 10 pips for a 0.1 deviation.
SUMMARY
Potential Profit (in points): 1124
Potential Trading Strategy: Enter with the initial spike and a 10 point stop loss ; trail the stop to breakeven after 30 points and take profit at 100, 300 and 500.