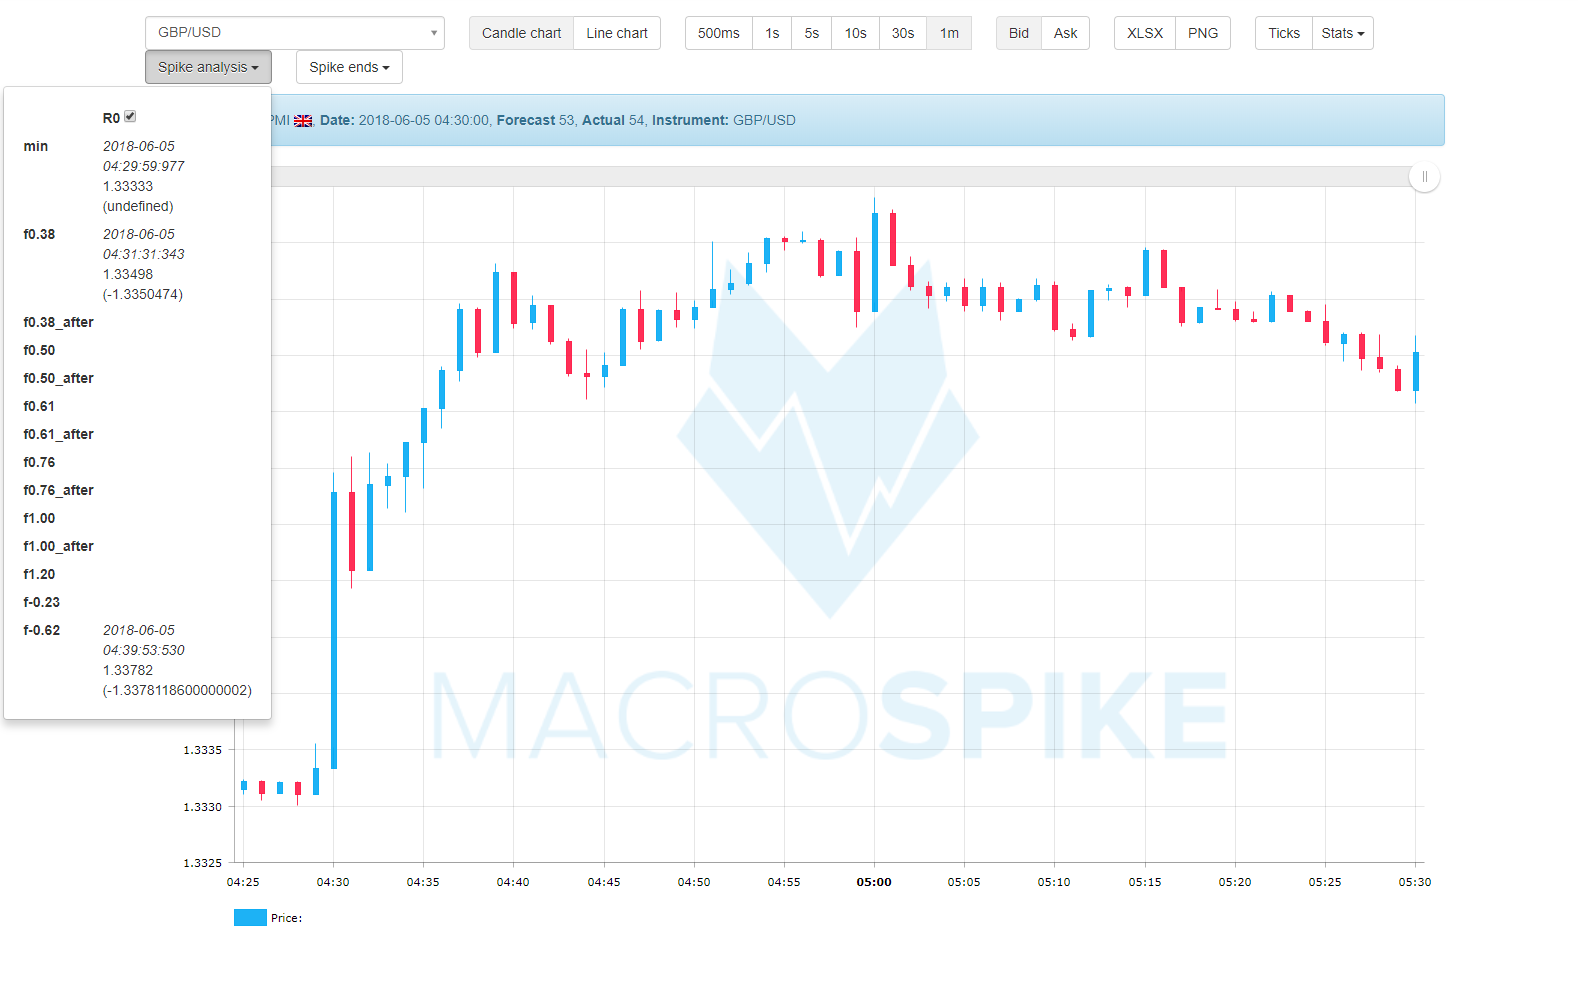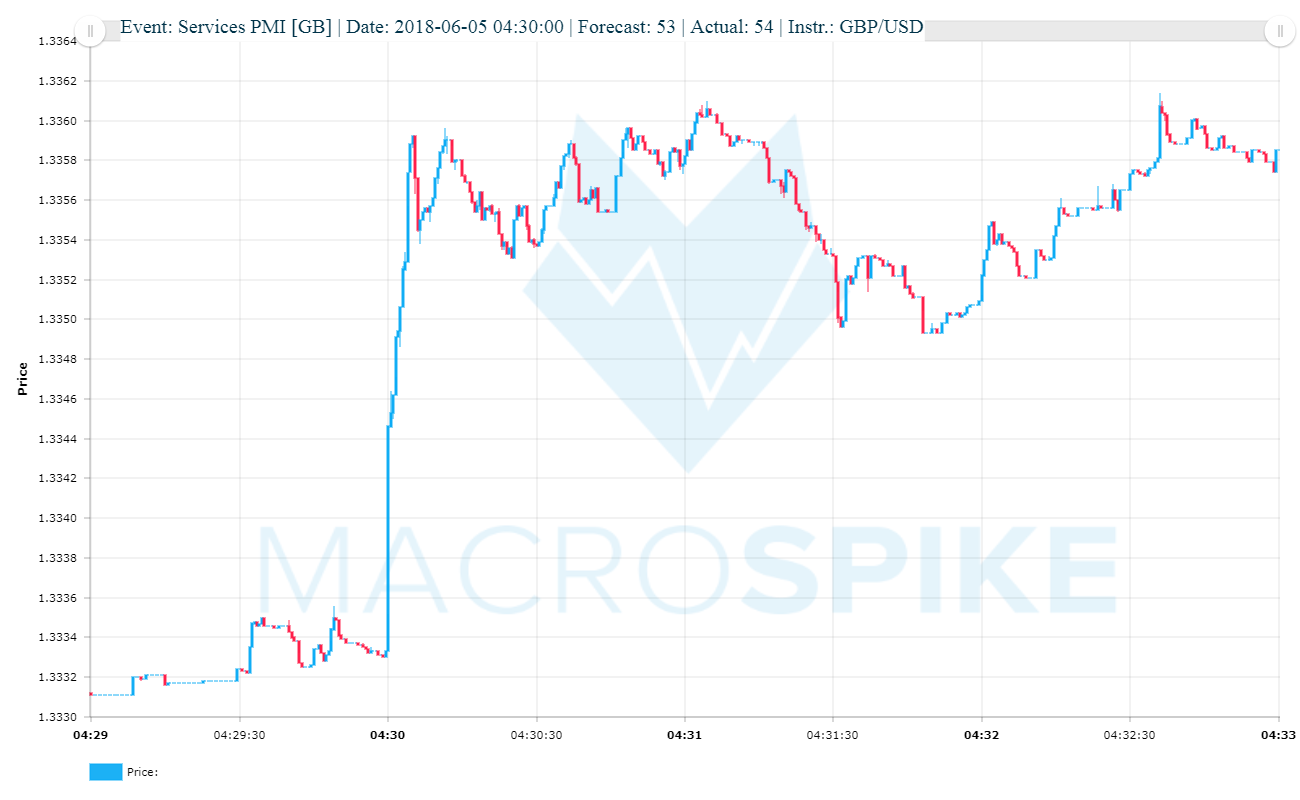

This morning, if you followed the announcement of the Services PMI for the British Economy, you could see a nice example of a 38.2% Fibonacci spike retracement being hit just one minute after the PMI release. Readers that follow our work, should be familiar with this trade setup that often reaches the -61.8% profit target.

GBP/USD spiked up 10 pips within 500 milliseconds on a +1.00 deviation from analyst forecasts. Price did not stall immediately and one could clearly see aggressive Buy Market Orders taking out Limit Sell Orders and GPB/USD trading up 25 pips within 4 seconds. In scenarios like these – where price is being accelerated into one direction without any sign of resistance -, there is a high probability of a successful 38.2% Spike Continuation Trade with a Take Profit at the -61.8% Level.

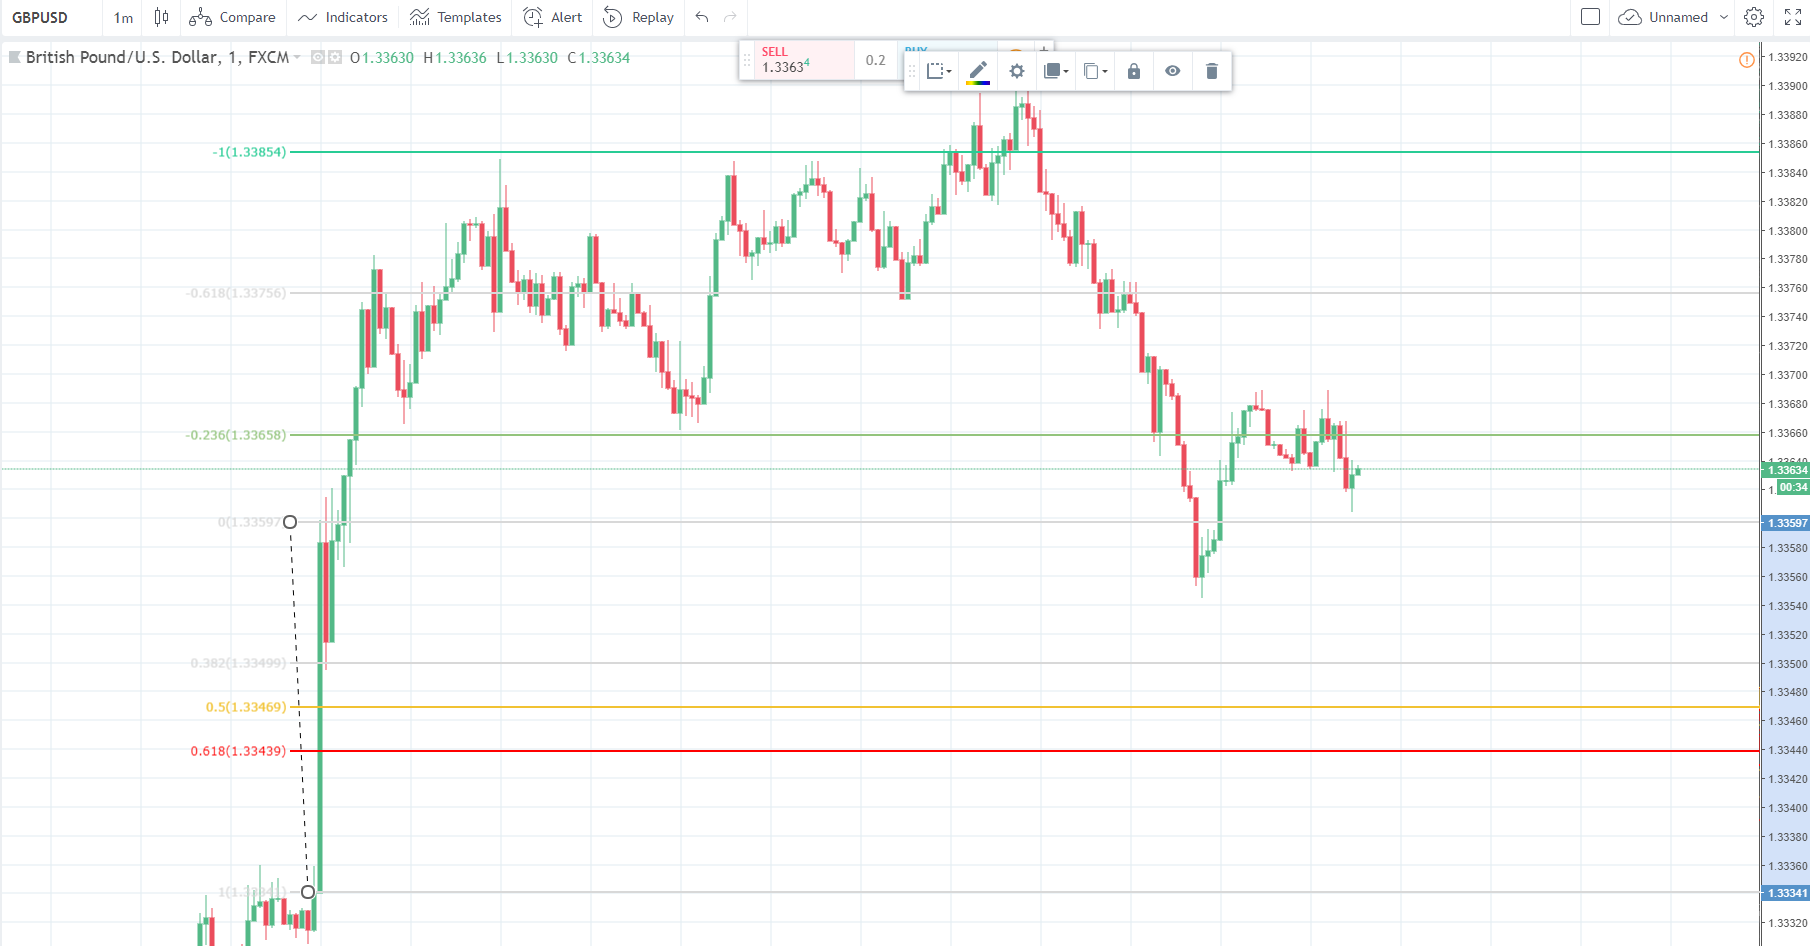
See above how on the 1-minute chart price reversed and continued into the direction of the spike, with the -61.8% level reached after just 10 minutes. This could be one of the clearest, simplest and easy-to-follow setups that can lead to extraordinary results. Let’s recap the 38.2% setup at this point:
The 38.2% Setup
Let’s take the low of the spike on the 1-min chart and make a Fibonacci drawing to the high of the spike in order to measure the size of the spike move. Whenever a spike is formed that sustains at least some of its momentum and does not reverse within the first minute, we have the possibility of a continuation move. This continuation move can be either started from a 38.2%-, a 50%-, or a 61.8% retracement level and ideally has targets at the -38.2% (for the 61.8% spike continuation trade), the -23.6% or -50% (for the 50% spike continuation trade), or -61.8% ( for the 38.2% spike continuation trade).

The price action following the release was indicative of a sustained price advancement. The 38.2% retracement was reached after 90 seconds giving a clear and concise trade entry with a target at 1.3378. Possible Stop Loss levels would naturally be points below the 50% and the 61.8% line.
After all these years, it still amazes me how accurate certain price levels are being treated by traders and computer algorithms. Once the GBP/USD pair retraced to the 38.2% level, it went right to the -61.8% target, went back to the -23.6% level, being catapulted to the -1.00% level shortly after, only to fall back to the -23.6% level again.
The validity of Fibonacci numbers
However, let me utter some words of caution here. As with all trading concepts and strategies, Fibonacci numbers and measured moves should be taken with caution and can only be properly understood in their right context. Not every price move can be measured with the Golden Ratio to a satisfying degree. Most of the times, global currency markets especially, tend to be stuck in price ranges. That means, that a lot of trend-based trade entries with no proper catalyst will be resulting in a losing transaction.
In the case of a catalytic event, a price disturbance initiated by a fundamental factor, chances are indeed higher for a sustained move since the market yet needs to price in new information. It not surprisingly appears that the combination of readily-released fundamental data, the degree of surprise herein, and the subsequent order flows define the direction price will take immediately after a release.
These order flows following a surprise in data cannot continue in one direction without retracing. Fibonacci retracements are logical price levels where proprietary traders, algos, and institutions get a chance to enter with a good risk-reward ratio.