
Fibonacci retracements in online trading
Leonardo Fibonacci was an Italian mathematician of the Middle Ages that is mainly known for his work on the Golden Ratio and the Fibonacci sequence. In the Fibonacci sequence of numbers, the sum of two previous numbers constitutes the actual number: 0,1,1,2,3,5,8,13,21,34,55,89,144,233,377,610… till infinity. He discovered that each number is about 1.618 times larger than the previous number with “1.618” being called the Golden Ratio.
Fibonacci Retracements used in financial trading
The numbers in the sequence are not used directly. What traders do instead is taking relationships between the numbers as anchor points in order to measure price movements and potential levels of support and resistance. The Golden Ratio is derived from a simple division of a preceding number with the following number in the sequence: 13/21 = 0.618. If the division is made with the 2nd number to the right, we arrive at another important level that is widely used in online trading: 13/34 = 0.382. Dividing the “13” with the 3rd number in the sequence results in: 13/55 = 0.236.
Traders mostly use the above-mentioned levels along with their inverse and symmetric difference levels. 1.618, 0.382 and 0.618, 0.236 and 0.764, -0.618 and -0.382, -0.764 and -0.236.
Even though the 0.50 / -0.50 level is formally no Fibonacci number, I would still have it mentioned in this very context, because it is a very important trading level. Same goes for 1.00, 2.00, -1.00 and -2.00.
In order to arrive at the horizontal Fibonacci level grid, all we have to do is to pick a low and a high point of a recent move up or down and use the Fibonacci retracement drawing tool from our platform of choice.
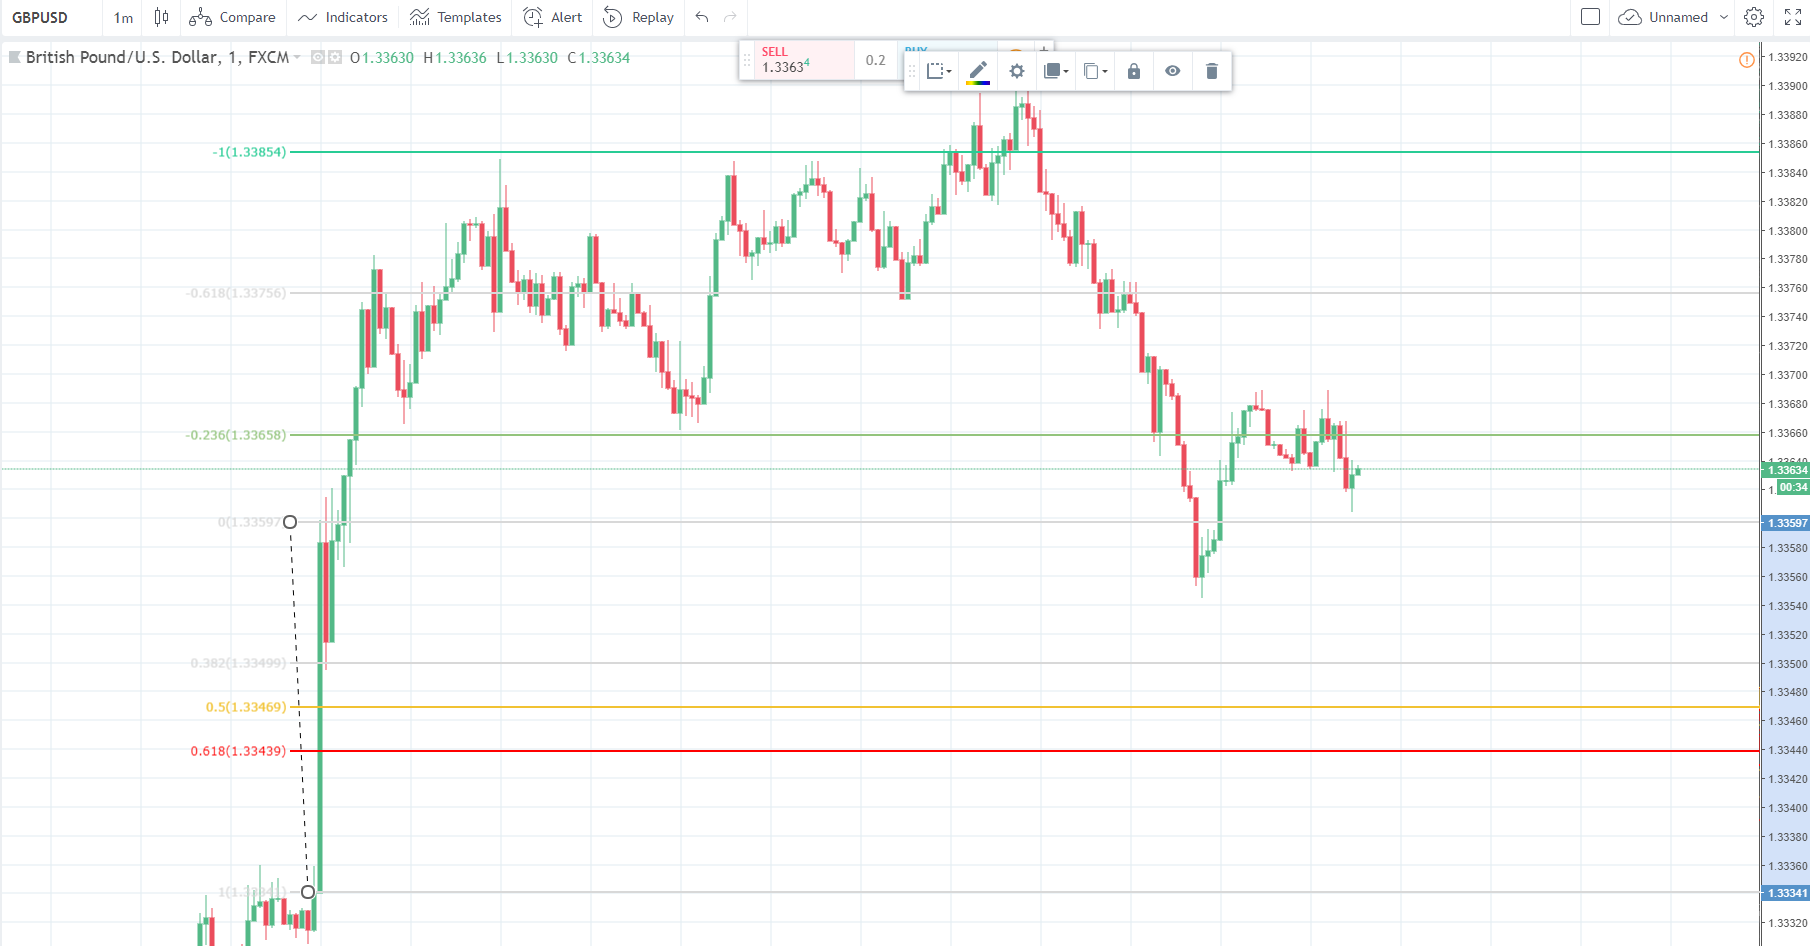
There is a certain degree of subjectivity in drawing Fibonacci retracements. Different timeframes and different anchoring points for the high and the low of the measured move will produce different Fibonacci levels. Applying a drawing to an opposing measurement will add a level of complexity – and not seldom – confusion to the trader who must judge on the importance of the two opposing setups.
As with all technical studies/indicators, traders need to find a sweet spot between complexity and usability of the strategy. Too much complexity will most probably lower your trading edge (at least that is what our research suggests). No complexity will give you no edge over a simple random chance experiment – think of tossing a coin. While we are not sure whether a simple Fibonacci strategy, with no other inputs other than Fibonacci levels for entry and exit, can be traded profitably, using it in the context of measuring news-enhanced price volatility proved to be a reliable approach.
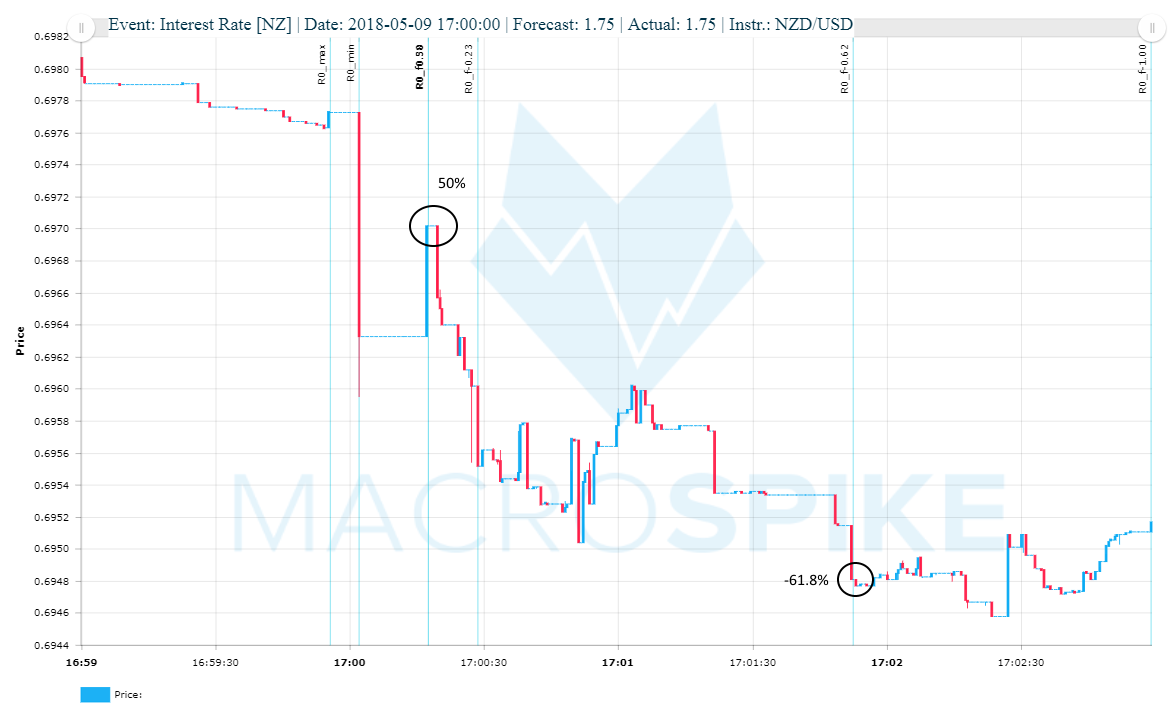
The 50% Fibonacci retracement trade
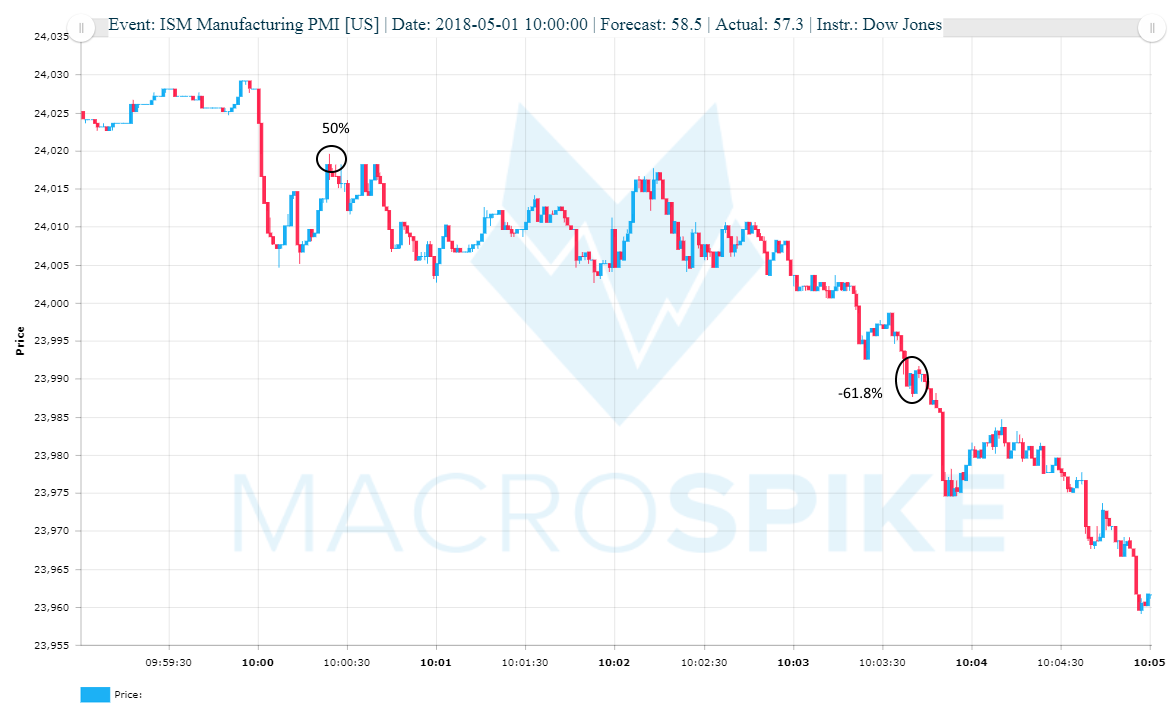
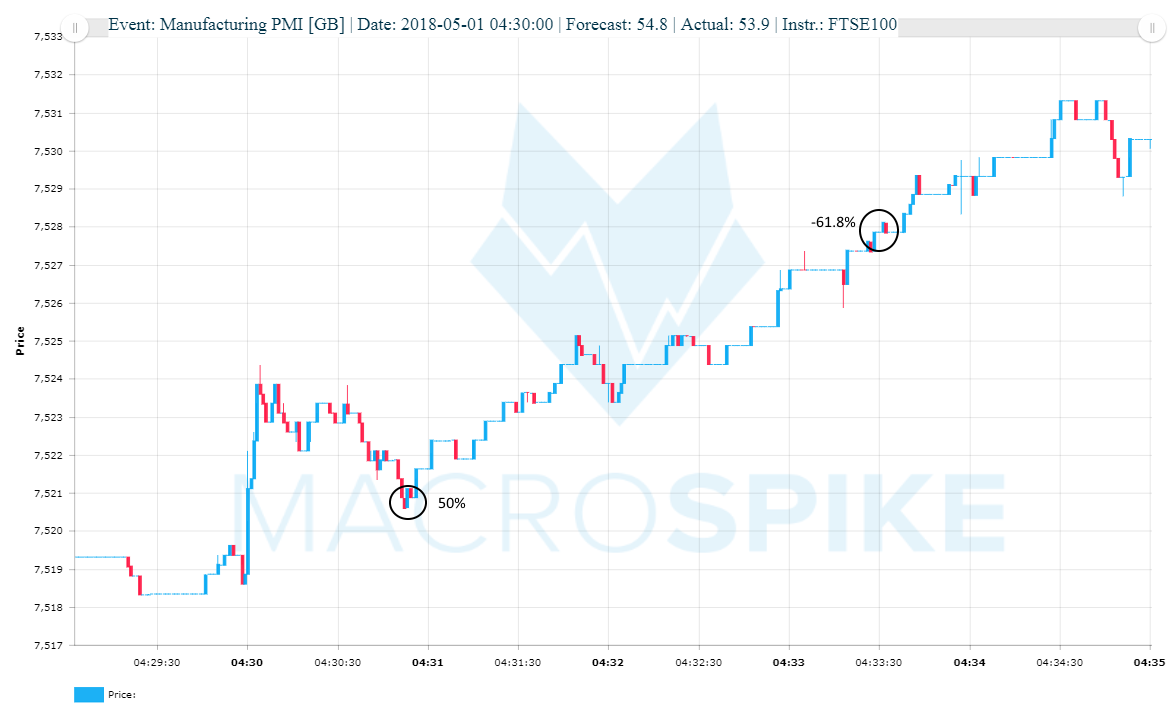
One setup that maybe stand out in terms of popularity is the 50% retracement trade with a profit target at -0.618 and a Stop Loss below the 0.764 level. The instructions:
(1) Wait for a news-driven spike on the 1-min or 1-sec timeframe
(2) Enter in direction of the spike at the 50% retracement of the total move. If the total spike move is 10 pips, wait for a retracement of 5 pips before pulling the trigger.
(3) Put in a Stop Loss Order 1 pip/ below the 0.764 level
(4) Take Profit Order at the -0.618 level
Fibonacci Retracements and Liquidity
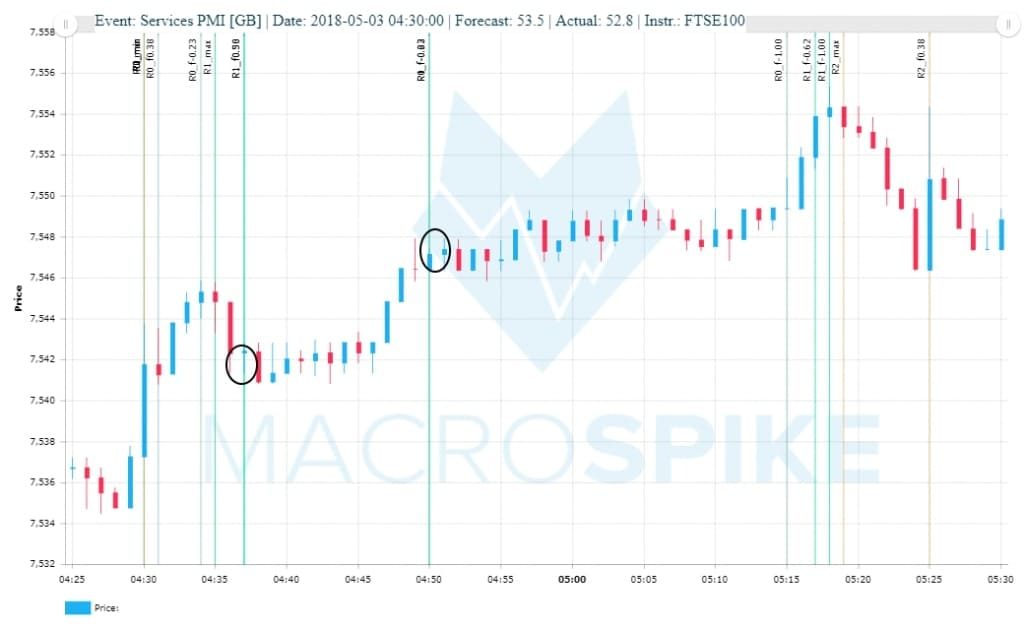
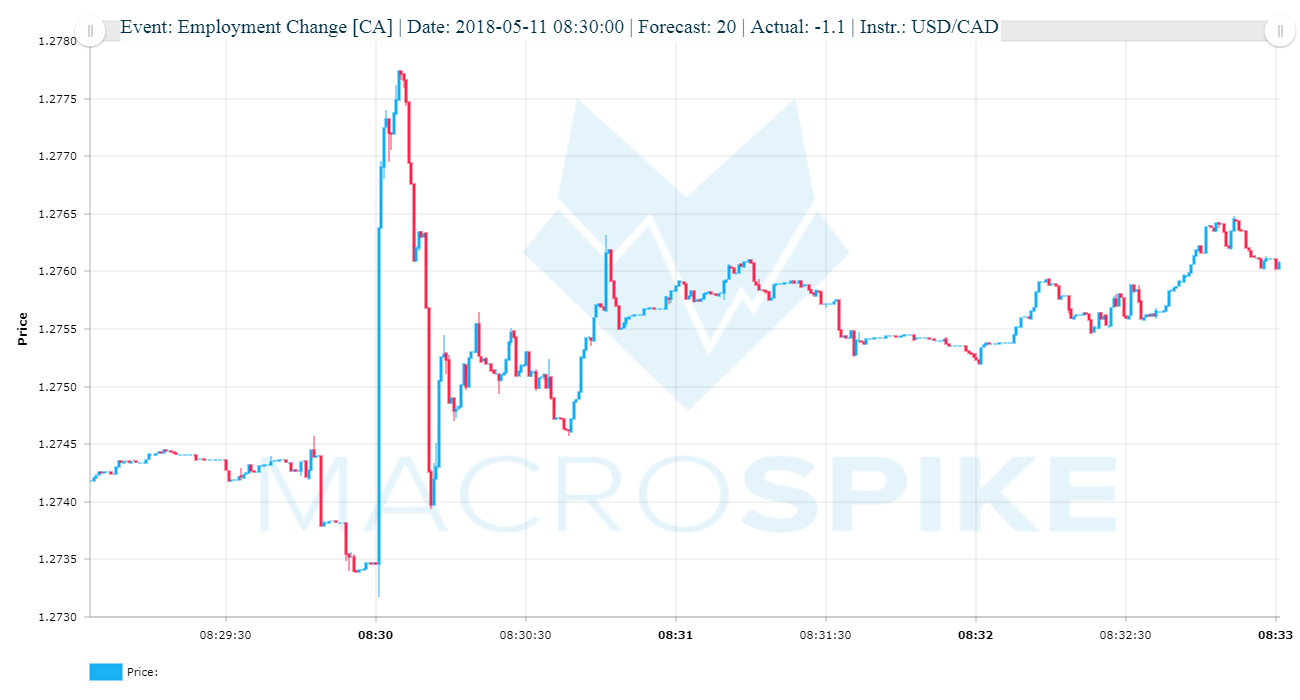
Several lower-liquid instruments can experience immediate spike reversals/ retracements to what can be attributed to liquidity in general and the pulling back and reinstating limit bids and offers – immediately before and after important economic announcements – in particular. Let us have a look at a recent event-driven trade, namely the release of the Canadian Employment Change m/m on 2018-05-11. A -21 deviation from analyst forecasts was significant in order to push the USD/CAD pair up 42 pips within just 3 seconds. After 10 seconds, however, the Canadian Dollar retraced to the 0.764 Fibonacci level and below.
Adding and Removing Liquidity
Liquidity can be understood as the total amount of non-marketable limit orders on both sides of the limit book. The best spread between the lowest ask and highest bid hence is a true measure of market liquidity. Liquidity increases by non-marketable limit orders being added to the limit book. Liquidity decreases when market participants pull limit orders out of the limit book. That is why the spread between the bid and the ask widens before scheduled news events.
Example of a non-marketable limit order
If the current ask price of the instrument is 100.00 and you enter a limit buy order at 99.99 you add a non-marketable order to the limit book. The order is non-marketable because it is added as the best current bid in the limit book and not executed immediately. While non-marketable limit orders add liquidity, marketable orders remove it. Marketable orders are either market orders or limit orders above the current ask or below the current bid.
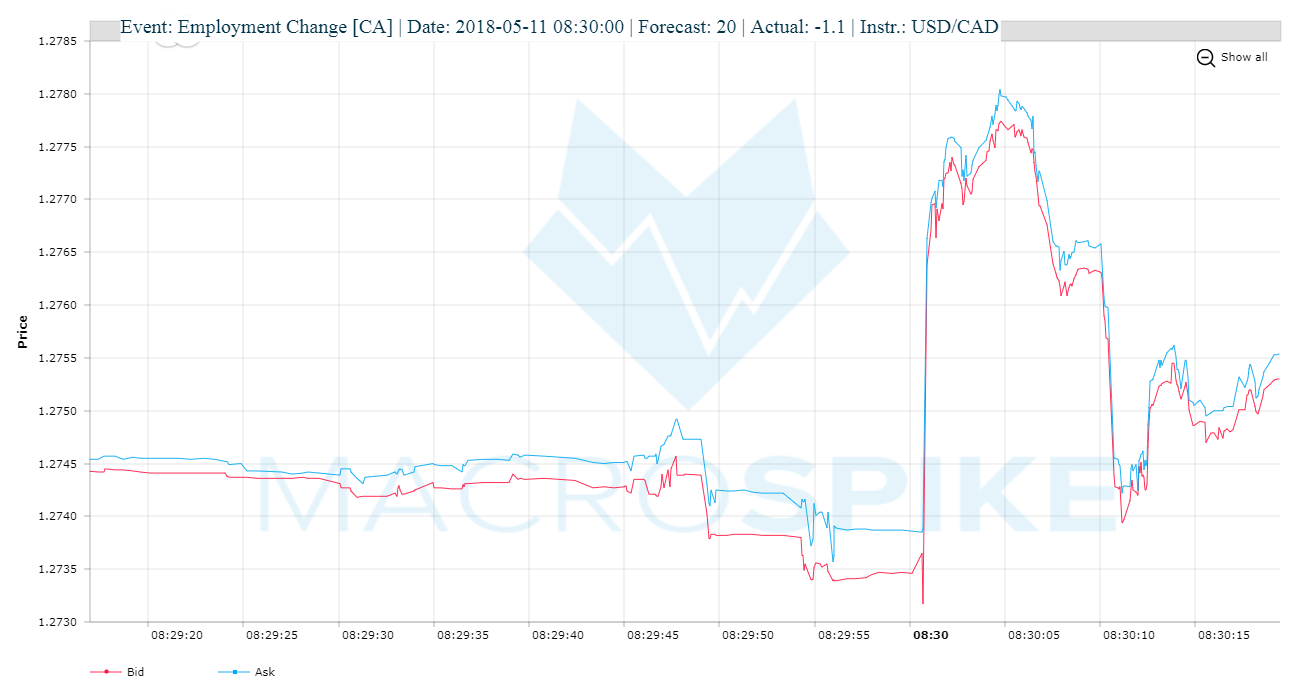
Notice how the bid-ask-spread starts to widen at 08:29:30 and gradually increases until the news release at 08:30:00. The spread is the highest 500 milliseconds before news time at 7.2 pips. As soon as the news is released, spread tightens to normal levels. Traders reinstitute their limit orders, the limit book(s) refill with new limit orders and liquidity increases.
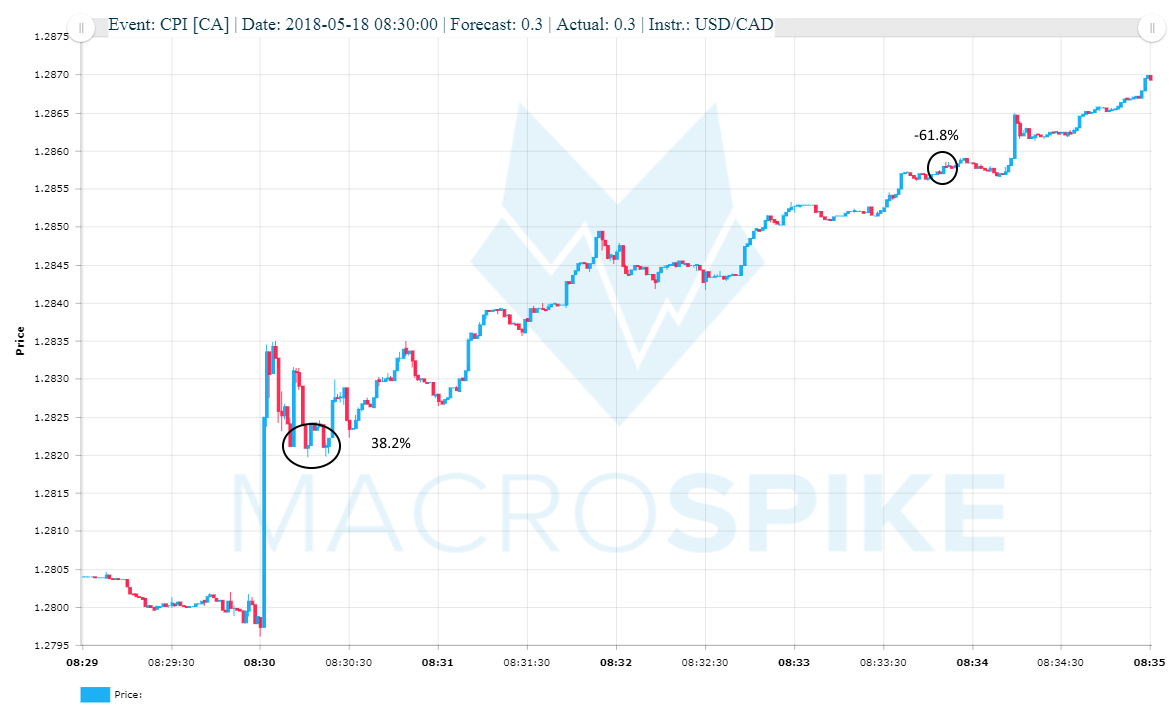
The 38.2% Fibonacci retracement
Another reliable trading setup is the 38.2% Fibonacci retracement following a liquidity spike.
The instructions:
(1) Wait for a news-driven spike on the 1-min or 1-sec timeframe
(2) Enter in direction of the spike at the 38.2% retracement of the total move. If the total spike move is 10 pips, wait for a retracement of 3.8 pips before pulling the trigger.
(3) Put in a Stop Loss Order 1 pip/ below the 0.618 level
(4) Take Profit Order at the -0.618 level
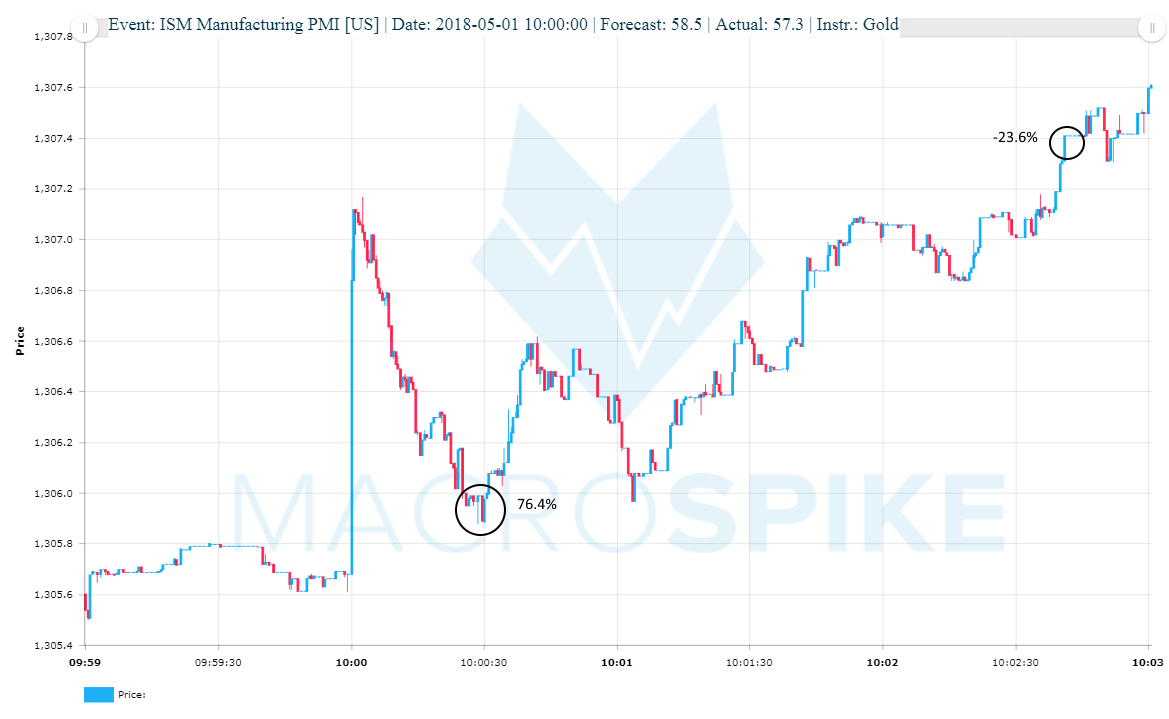
The 76.4% Fibonacci retracement
This trade setup is often preceded by a fast and short-lived spike reversal followed by a rapid advance above spike highs.
The instructions:
(1) Wait for a news-driven spike on the 1-min or 1-sec timeframe.
(2) Enter in direction of the spike at the 76.4% retracement of the total move. If the total spike move is 10 pips, wait for a retracement of 7.6 pips before pulling the trigger.
(3) Put in a Stop Loss Order 1 pip/ below the 1.00 level.
(4) Take Profit Order at the -0.236 level.
