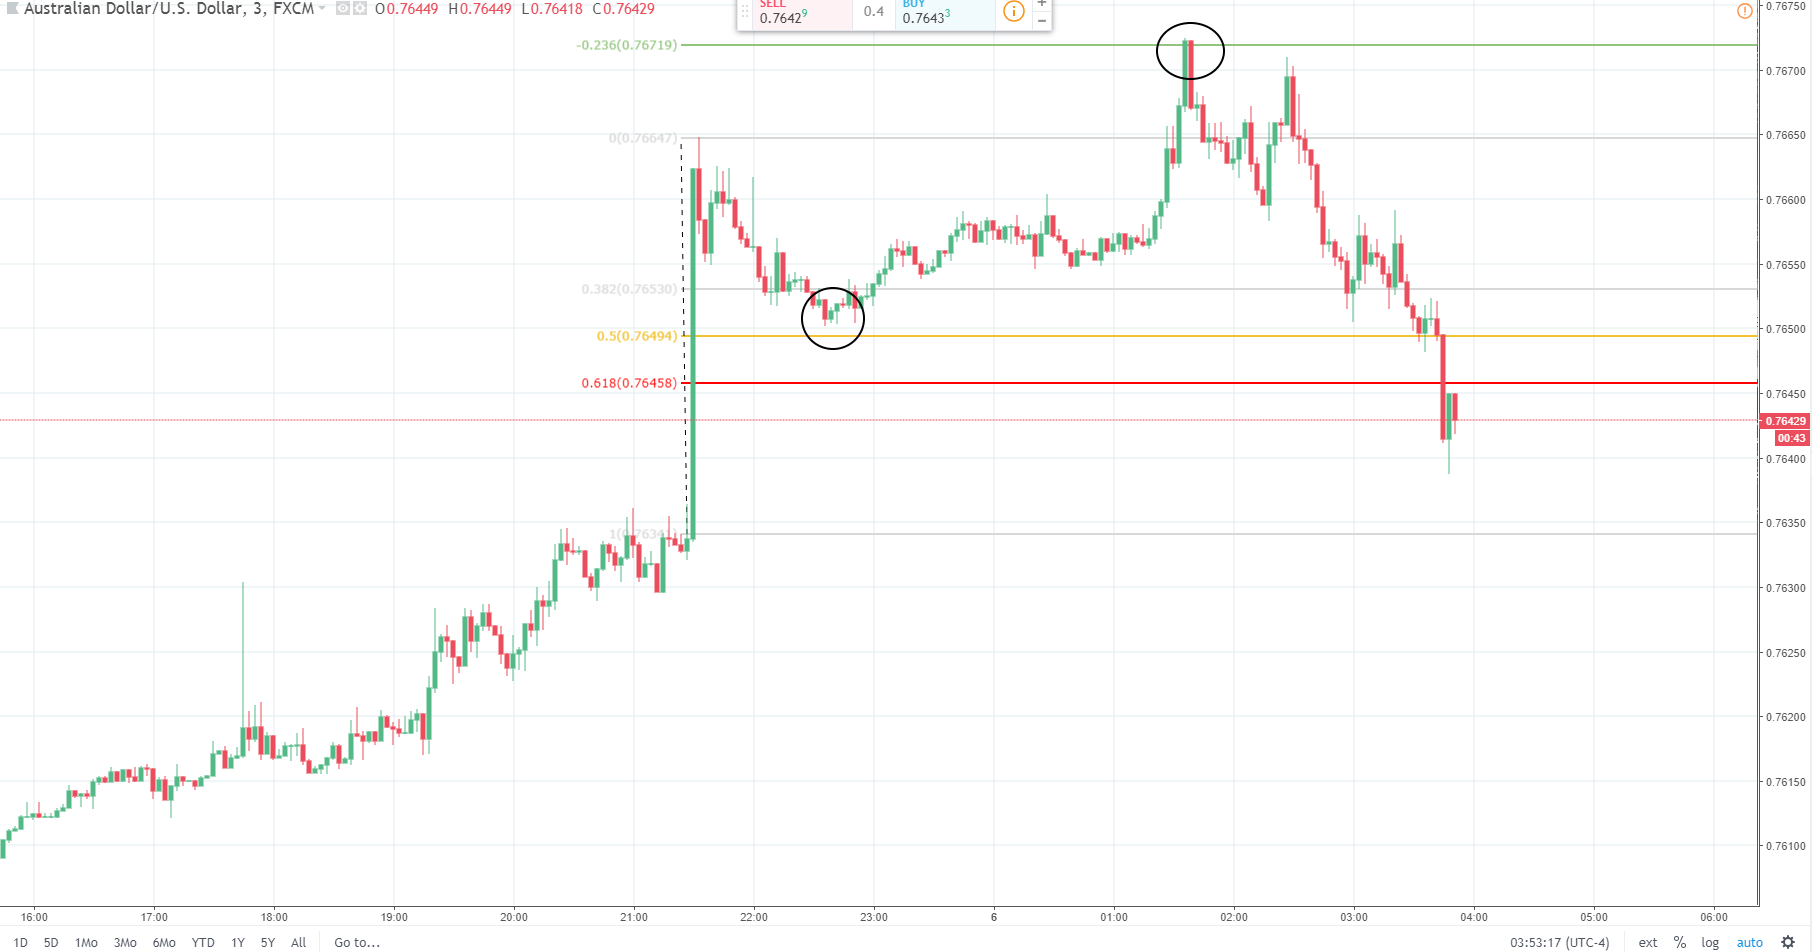

Late night traders had the chance to witness a nice and clean retracement move right into the -23.6% Fibonacci target on the Australian Dollar/U.S. Dollar on better than expected AU GDP data. The 50% retracement was touched about one hour after the release and went into the -23.6% level 3 hours later. Notice how those traders entering at the 50% line used this level in order to take profits.
The 50% Setup
Following a liquidity spike of decent size, enter in direction of the spike as soon as the price of the instrument has retraced by 50%. I am using the Fibonacci retracement measuring tool for measuring retracements. The 50% level is not a Fibonacci number, but professional traders widely respect it and use it as a level of high importance for trade entry (and exit). On a 50% retracement setup we often see prices reaching the -23.6% target at first. Then, either retracing in direction of the gap or, continuing in direction of the spike to reach the -61.8%, -100%, even the -200% target (which is exactly 2x the initial spike size).
