
An introduction to economic indicators and news trading
This is an introduction to economic news trading. Primarily designed for novice news traders, it gives an overview of how and why news trading works. Although it will deal with some basic econometrics, this is not a textbook article. It is written for and by news traders and therefore focuses on how we can make use of macroeconomic data in our everyday decision making. Hence, it may also contain valuable information for those already experienced using fundamental data in their trading strategies.
Trading on publicly available information has been popular for as long as stock and other market exchanges have been operating.
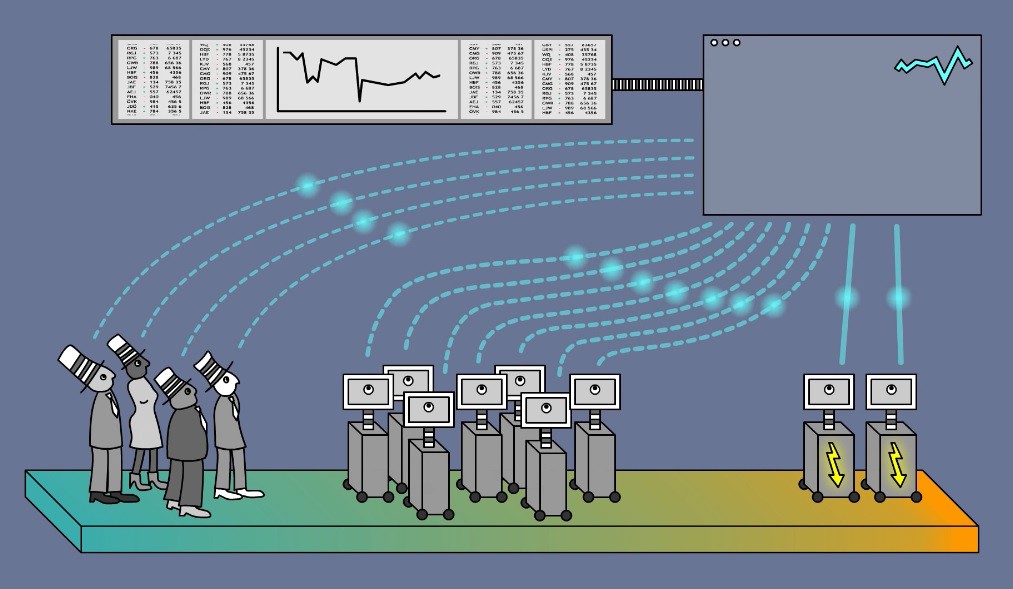
What has once been accomplished by reading financial newspapers and later by acting on financial audio news feeds, is, in many ways, nowadays fully computerized. Most financial news is accessible in binary format and therefore readable by machines. And with the advances in informational technology and the accessibility of large amounts of data modern-day news trading has reached the home offices of retail traders.
ECONOMIC NEWS AND FUTURE EXPECTATIONS
So how do these bits and bytes drive financial markets? How can a trader build event-driven strategies and capitalize on repeating patterns of price behavior? Why should even technical or price action traders have an eye on trading the news?
Asset prices are heavily influenced by underlying macroeconomic factors. The broader an asset class, the more sensitive it generally is to the anticipation and release of important events. Thus, macroeconomic news plays an important role in the price discovery of currency rates, treasury instruments, index and commodity contracts.
Price as a variable can be understood as the aggregate of its future expectations discounted to the present.
Astonishingly few retail traders fully understand the meaning of these words.
Current market prices, as a matter of fact, represent the actual market equilibrium. This equilibrium is constantly being challenged by the plethora of trader’s beliefs about the markets.
The current price of an asset is an aggregate of
Its future expectation discounted to the present
moment.
Macroeconomic news reports are a means to quantify and compare modern economies. Although economies are very complex these reports provide detailed information about the economic activity such as interest rates, employment, growth, and inflation. These constantly changing indicators form long- and short-term market cycles that can or cannot align with long- and short-term business cycles. Understanding the relationships between the two is crucial for any kind of long-term investor.

Many important global institutions, government agencies, and private enterprises track the release of economic indicators closely in order to assist them in their decision making.
Long-term macro traders invest in anticipation of macroeconomic trends and thus mainly anticipation of future central bank moves. Front-running central bank actions have proven to be a very reliable and profitable method for many successful traders.
Central Banks & Interest Rates
A central bank is a key player when it comes to influencing a country’s currency. Not only are they the issuers of it – they are supervising all economic activity in a country and act as the main guarantor of price stability.
Central banks have a wide array of tools at their disposal. They’re by far most important though is to set the Main Interest Rate of an economy.
By setting this interest rates they directly influence the cost of capital at which commercial banks borrow money from the central bank.

Higher interest rates make borrowing money more expensive, slow down the economy and reduce the velocity of money in general. Central Banks do this to prevent an advancing economy from overheating or to clamp down rising inflation rates.
Viewed on its own, this is generally negative for equity markets, especially in the short-term.
Commercial banks are charged more for borrowing at the central bank which they pass down to private businesses and individuals. Mortgage rates, interest on credit card debt and all sorts of commercial and private loan arrangements are getting more expensive. This reduces the total amount of money consumers can spend in the economy. As credit gets dearer for companies, revenue and profits decrease and cause stock prices to fall.
However, depending on the reasons behind the central banks’ move and the stage of the interest rate cycle, a hike can also restore confidence in the economy and, as it attracts new capital flows, eventually lead to a positive outlook for the equity markets.
Generally speaking, the higher the interest rates of an economy, the more interesting investment become for international investors. This is especially true for Fixed-Income investments like government bonds.
The Carry Trade
Therefore, higher interest rates lead to inflows of international capital attracted by the marginal difference in rates: this type of phenomenon is known as the Carry Trade.
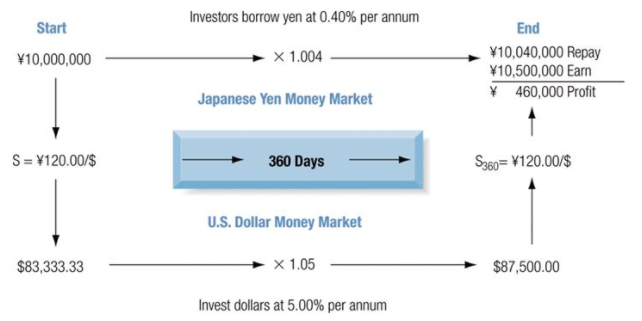
Borrowing in a low-yielding currency in order to invest them in assets denominated in a high-yielding currency is exactly that. The rate differential generates a net profit. If for example the rate for the US Dollar is 5% and the rate for the Japanese Yen is 0%, one could borrow in Yens and invest into Dollars and net the difference of 5% per annum. The Dollar-Yen-Carry-Trade is maybe the most popular of all times. In the period up to 2007 many traders and investors borrowed in Yen and used the money to go long the US Dollar and other currencies with a higher interest rate.
Where you want to be is always in control, never wishing, always trading, and always first and foremost protecting your butt.
Paul Tudor Jones
News Events as Initiators of Market Trends
Price is a function of the discounted, aggregate future expectations of market participants about the state of international economies. In the end, every trader acts upon his own beliefs about the world and the economy. Market sentiments and trends are formed by many traders having the same beliefs about future outcomes of certain events. So each time when a macroeconomic report gets published, judgments are tested and may force traders to adjust their opinions about the markets.
This opens a small window of opportunity: new information is available, but not yet fully priced in.
This is where automated news trading systems like MacroSpike’s tools and strategies step in:
Our programs analyze marketing-moving data instantaneously and allow traders to participate at major market moves at the earliest possible stage.
But how can we, as analysts and traders, determine what the majority of market participants expects?
After all, markets are a complex conglomerate of millions of players who have very diverging views about the economy and world affairs. And just as their expectations differ, so are the conclusions they draw from them.
When determining current market bias, a time-proven approach is to derive it from economist forecasts. There are many professional forecasters working for large international banks or other financial institutions. These economists are regularly surveyed by news agencies like Bloomberg or Reuters to give their personal forecast for upcoming economic news events. By statistically weighing economist forecasts, one can get a pretty accurate idea on what the market expects.
Professional News Trading Software
However, market sentiment can never be entirely captured by analyzing analysts expectations. It is at least equally important to understand central bank policies and the political environment of a market economy in order to determine potential surprises and their effects on the markets. This is why professional news trading requires in-depth analysis of the complex macroeconomic picture. And exactly why MacroSpike exists.
Now that we know about the importance of interest rates let’s take a look at what happened to the USD/CAD exchange rate when the Canadian Central Bank cut interest rates on January 20th, 2015.
The Bank of Canada unexpectedly decided to cut interest rates by 0.25% from 1.0% to 0.75%. All polled economists had forecasted that interest rates would stay at 1.00%. In addition, some even expected a gradual rise over the medium term. Hence, the cut came as a huge surprise to the majority of market participants.
NO ECONOMIST CAN FORECAST THE FUTURE WITH CERTAINTY
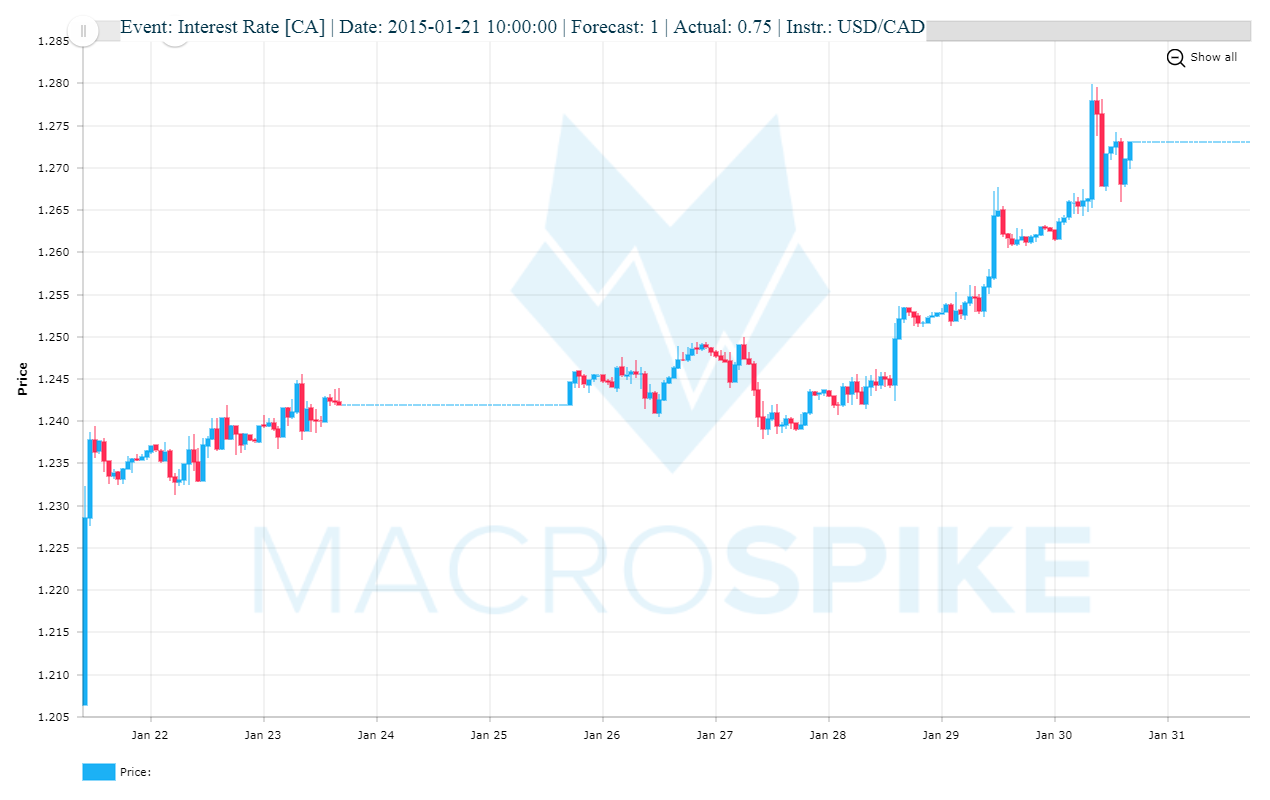
During the initial reaction, the Canadian Dollar spiked more than 170 pips against the US-Dollar. Over the next days, the CAD weakness continued and it finished some 700 pips lower against the US-Dollar just 10 days later.
It was really hard not to make any money on this trade. Prices went upside and did not return for a long time, the reaction was clear and steady. Even if you entered minutes/ hours after the report, there was ample opportunity! Big players made billions and we took our fair share.
Economic Data as brute market force
Notice how the price went up ignoring all technical indicators and price levels. Brute market forces at play.
This is a great example of how a single news release can have a huge impact on the exchange rate of a currency and become the main price driver for days and weeks that follow.
Depending on the importance of a news report and current market sentiment, markets tend to trend in the direction of the surprising event from a few minutes up to several weeks. Since not only traders and investors, but also central banks are heavily data dependent, certain events themselves become catalysts for new market trends.
Macroeconomic data has proven itself very valuable to gauge where the economy and markets are heading. Surprising events can change the way investors perceive the underlying economic sentiment. Major players base their actions and reactions on these releases just as much as central bankers do.
News releases are crucial inputs for all market participants and no retail trader can afford to ignore them.
They command new supply/ demand curves and market equilibriums being often the key factor big players watch.
Canadian GDP
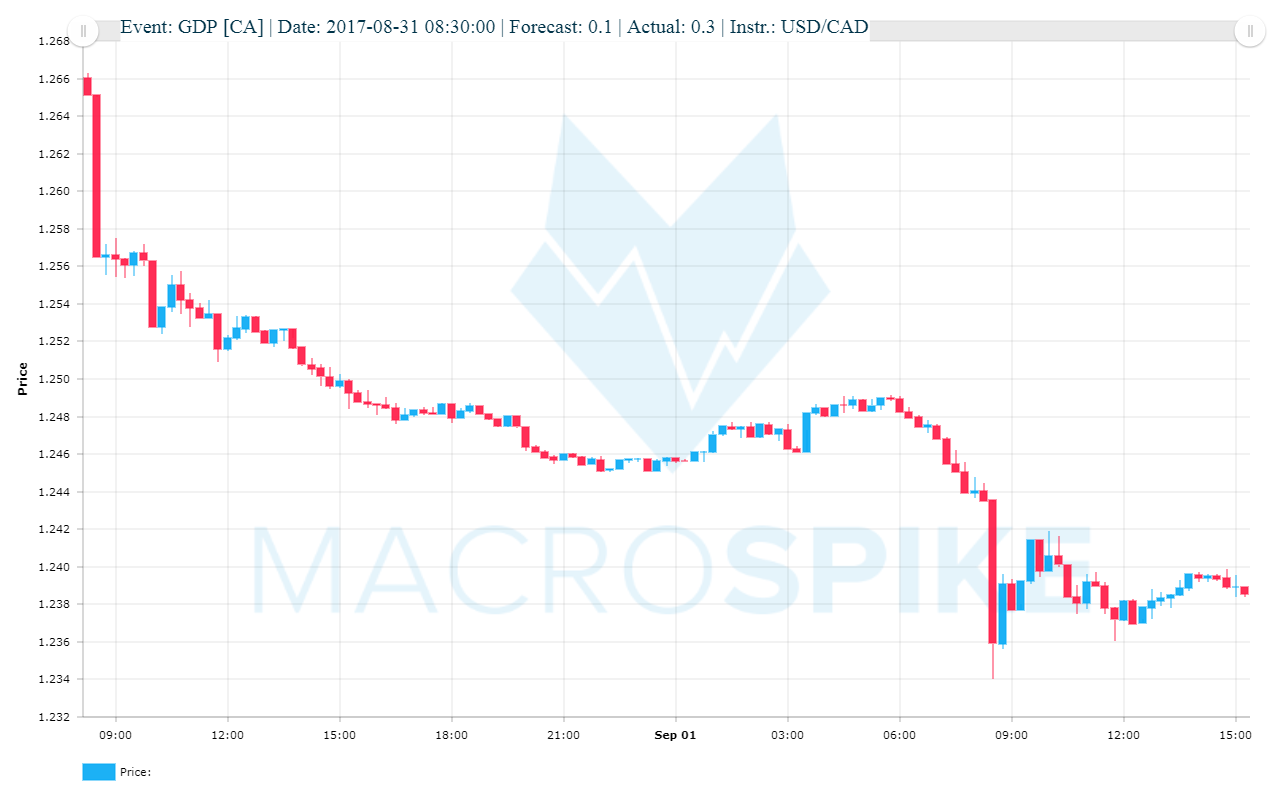
Let’s look at another trade that we had on the 31st of August 2017 – CAD GDP M/M It’s a good example how news trading has a meaningful impact on order flows.
Until the report, USD/CAD was in a trading range and prices traded slowly upwards towards the upper band. The circle shows the time of the news event. The GDP numbers came out at 0.3%. It surprised analysts whose median expectation stood at 0.1%.
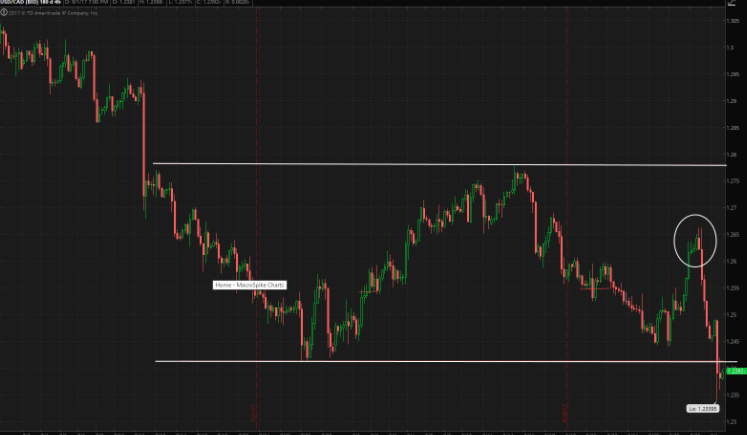
Notice how a +0.2 deviation from forecasts for CAD GDP M/M meant a swift change in market sentiment. Traders who wanted to advance prices to the upper band got caught blind sighted. Market sentiment shifted strongly after the release. It ushered doubts about the weakening of the Canadian economy. The USD/CAD currency pair dropped 320 pips within 24 hours, cutting through all stop levels. Simultaneously, interest rate expectations rose swiftly. Support levels have no meaning when the sentiment changes and big players commit to one direction.
GB CPI
Let us have a look at another example, this time from the UK. Here we can clearly see how a report can behave very different over time, depending on the market environment when it is released.
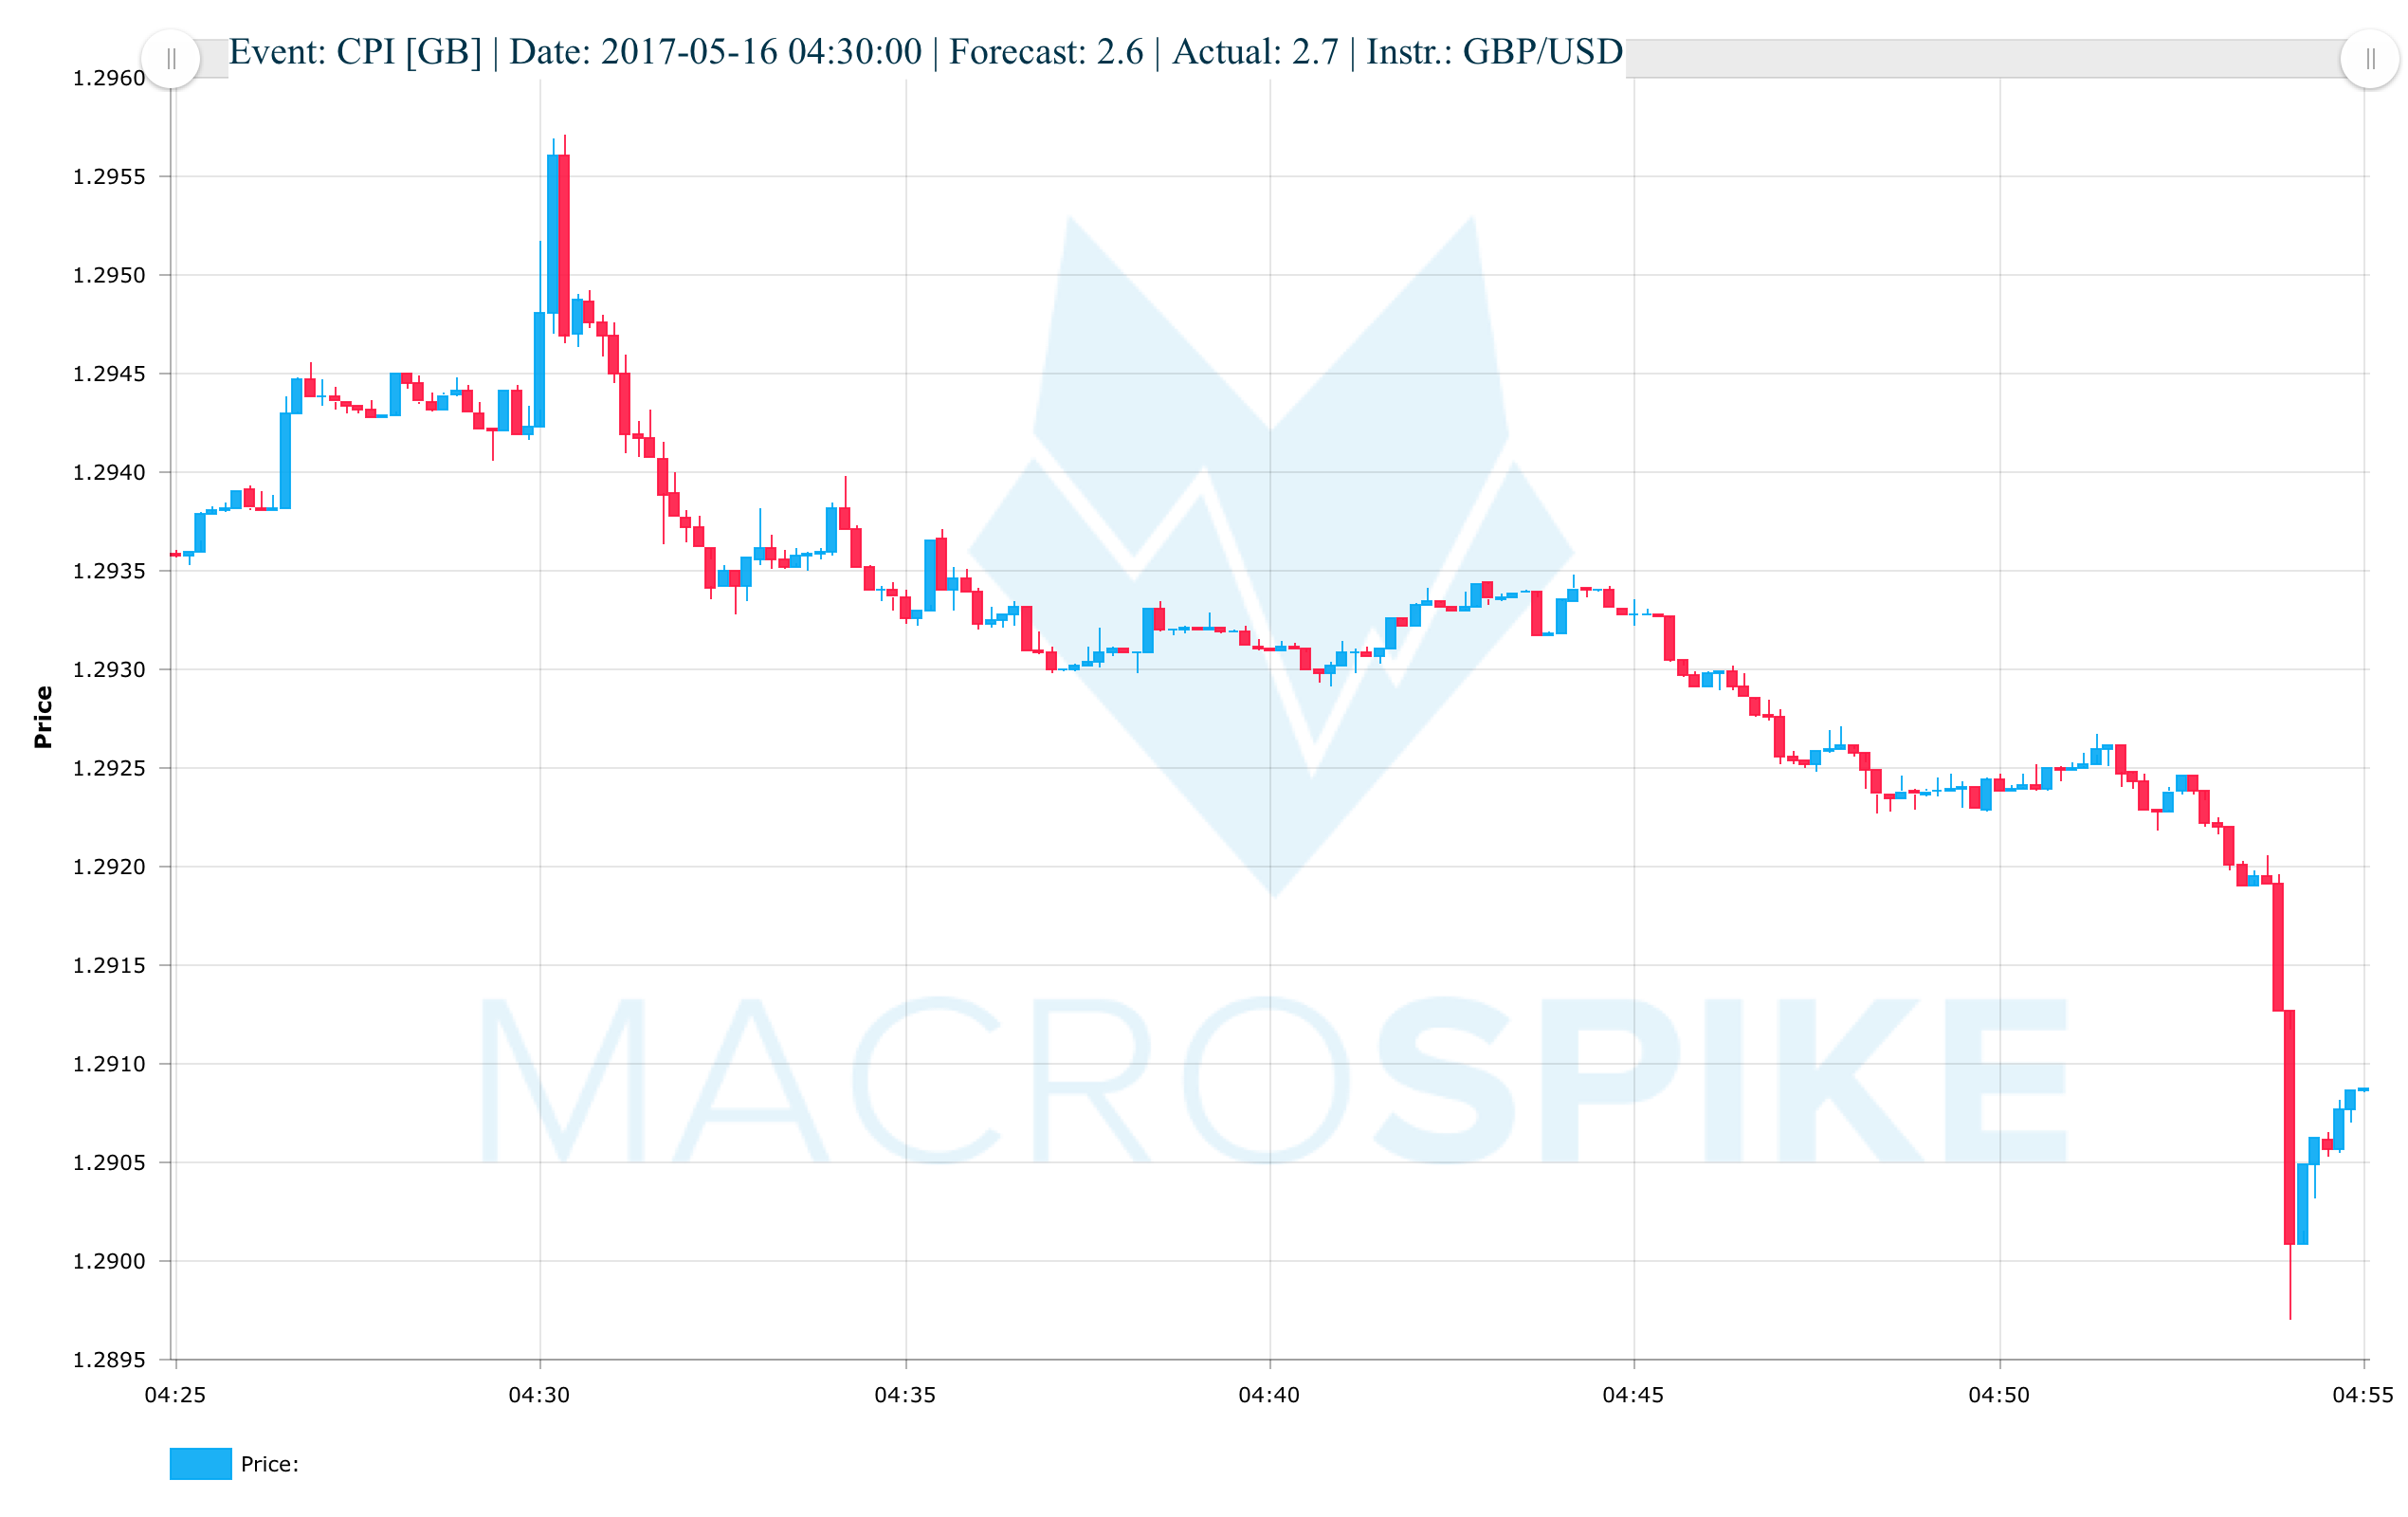
Year on Year inflation numbers ticked up +0.1% on their May release. However, GBP/USD spiked up a mere 10 pips and quickly sold off. Despite positive numbers, the Pound sold off 60 pips in the hours after the event.
Now let’s compare this to the reaction of the Pound to the Inflation number three months later:
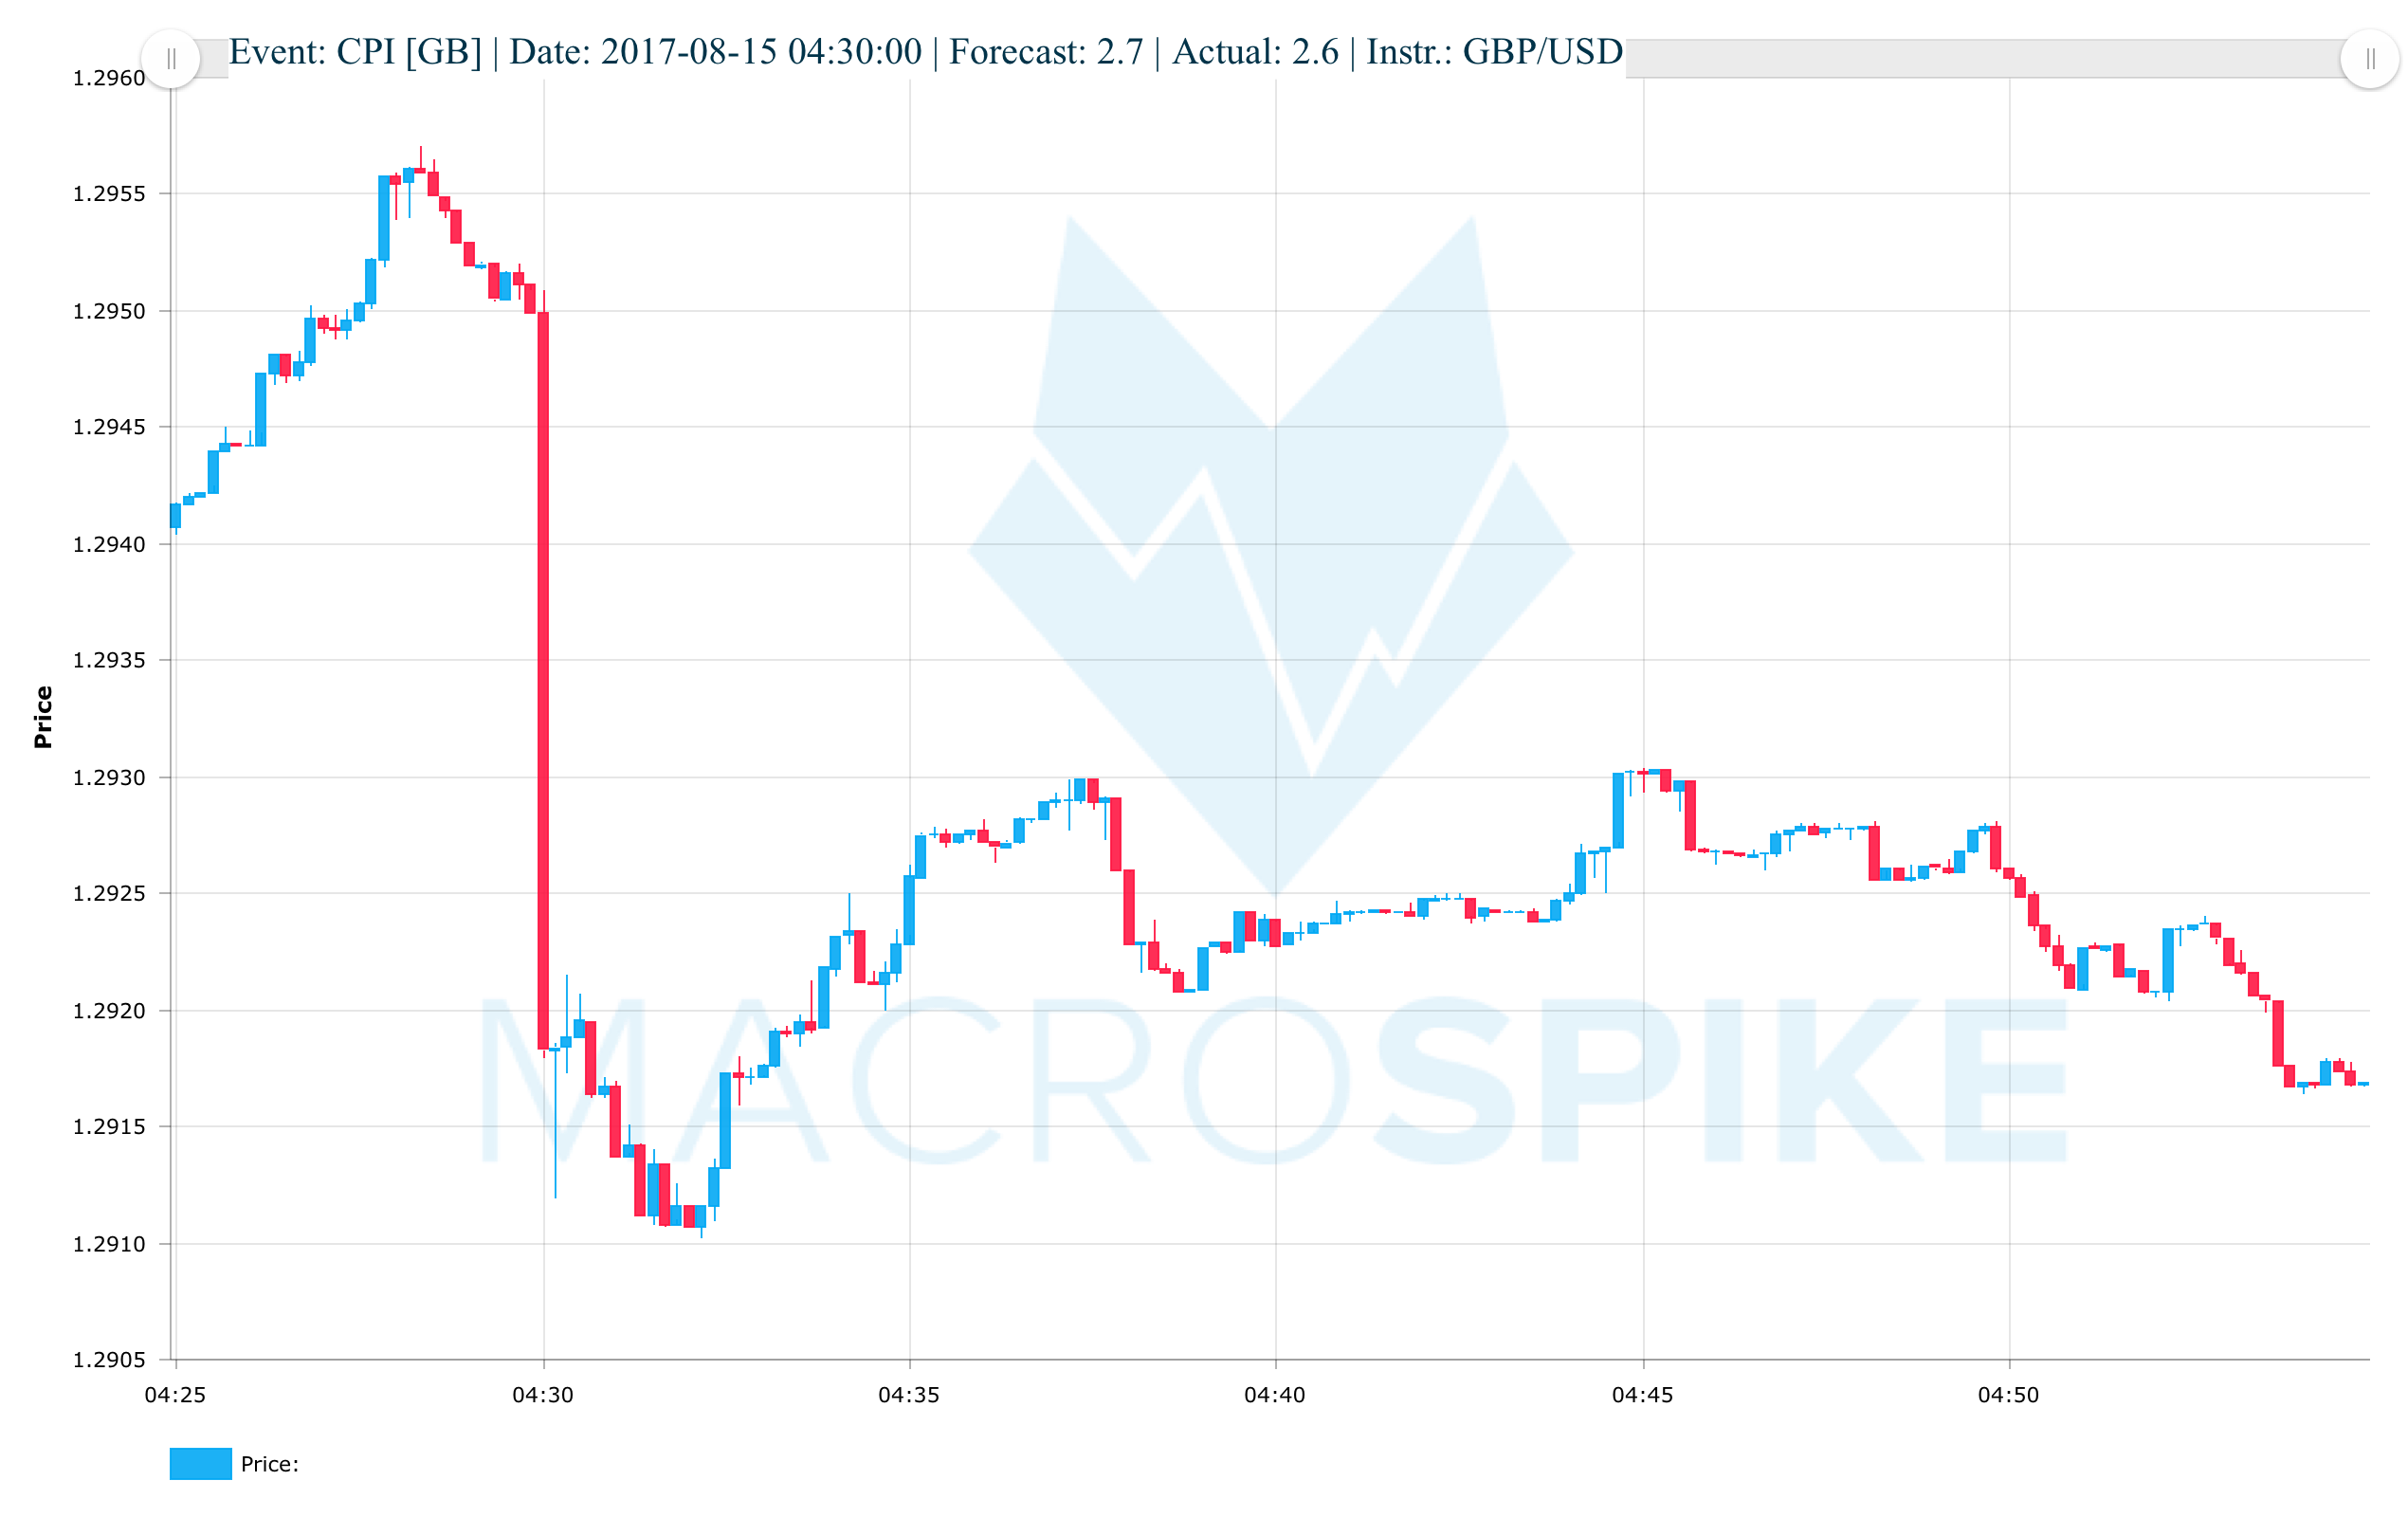
At 04:30 the UK released a widely followed inflation reading: GB CPI Y/Y – inflation numbers missed analyst expectations by -0.1%. GBP/USD immediately lost 35 pips- a move that extended to more than 150 pips in the days after the report. UK equities and government bonds also had a meaningful reaction.
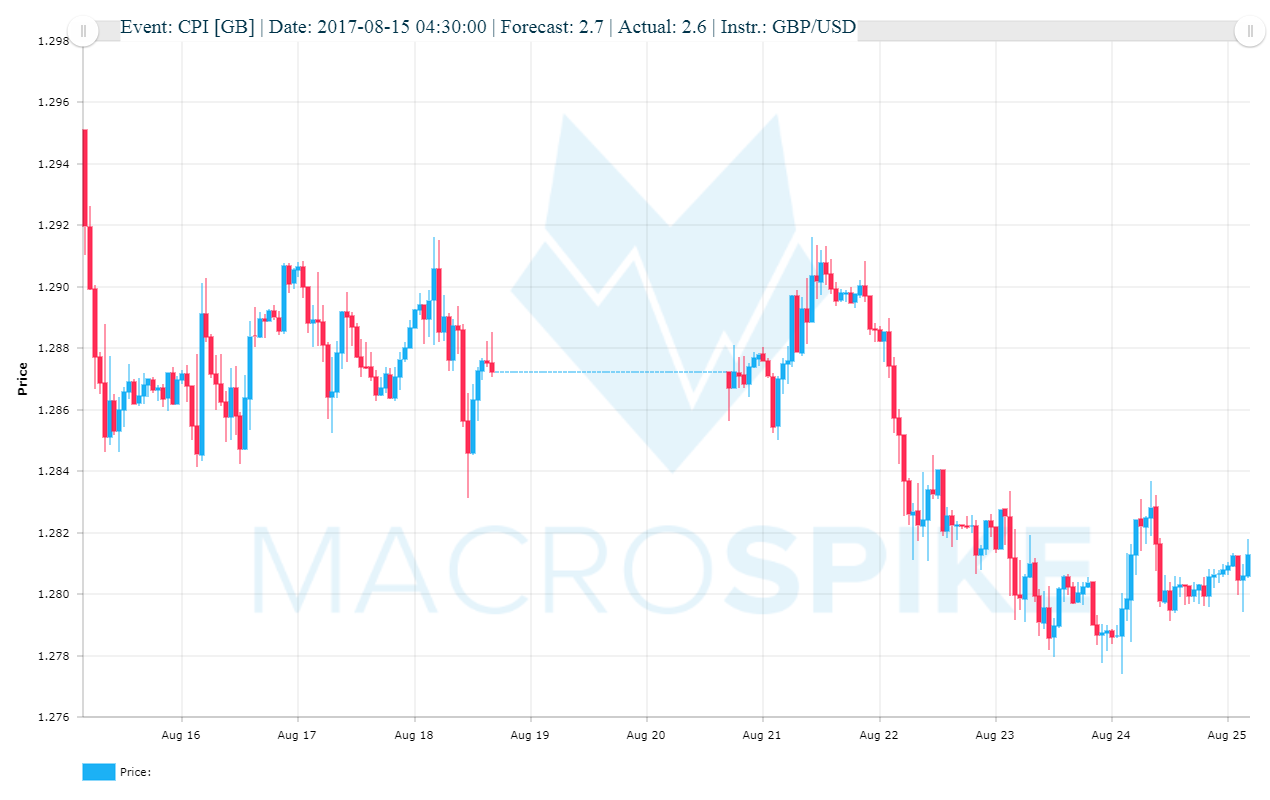
Event-driven market reactions
So what happened? How can the market’s reaction be so vastly different to the same release and even the same level of surprise?
The answer lies in the shift of market expectations about the interest rate outlook. The United Kingdom’s CPI had been continuously rising in the aftermath of the 2016 Brexit vote. The Bank of England, aware of this, had expressed that they would be willing to accept higher than expected inflation number in order to cope with the expected consequences of Brexit for the UK economy. Therefore, CPI numbers did not draw much attention to the market.
During the central banks May meeting, however, two of the BoE members surprisingly shifted their view on the outlook for the UK economy. They saw the economy stabilizing and feared that a continued rise in inflation would now pose a greater threat. Therefore, they now favor an interest rate hike.
With an interest rate hike now suddenly on the table, the CPI numbers gained more relevance for investors. The BoE has the mandate to assure price stability in the UK and avoid unnecessary high inflation. Spurring inflation meant a move towards a potential rate hike. This explains how the same release can provoke vastly different market reactions, depending on the macroeconomic context. It is vital to understand the current market sentiment. Simply approaching the same event with the same strategy can be extremely costly when news trading.
NEWS EVENTS CAN BE USED TO ENTER TRADES EARLY FOR UNFOLDING NEW MARKET TRENDS. EVERY EVENT HAS TO BE PUT INTO THE RIGHT CONTEXT IN ORDER TO UNDERSTAND POTENTIAL OUTCOMES
Important News Trading Events
There are thousands of news events released each month, but not all of them are watched with the same attention as the following ones:
- Interest Rate decisions
- Employment changes
- CPI (Consumer Price Index)
- GDP (Gross Domestic Product)
- Retail Sales
- PMI (Purchasing Manager Index)
- Crude Oil & other commodity inventories
These reports are so immensely relevant that they usually create decent volatility in case of a sizeable deviation from the median analyst forecast.
Economic data from the US tend to have the greatest impact on global financial markets due to the unique status of the US Dollar as the world’s reserve currency and the huge size of the American economy. The most important US reports are its central bank’s interest rate decisions and the monthly announcement of the change in the total number of Non-Farm Payrolls. Better than expected numbers will lead to a surge in the US Dollar.
Due to the interconnectedness of the global economy, surges or slides in the US Dollar will simultaneously have impacts on US Treasury, Gold, and international Equity Index Futures.
Traders also closely watch the announcement of the monthly Consumer Price Inflation (CPI), changes in the Gross Domestic Product (GDP), monthly Retail Sales numbers, the Institute of Supply Management’s Indices as well as the Consumer Confidence and Sentiment data.
Energy commodities have weekly announcement dates that inform traders about Crude Oil and Natural Gas inventory levels. An unexpected build in inventory stocks will generally lead to a drift in prices of the commodity, a fell in stocks will send prices soaring.
Important News Trading Currencies
Other big economies have their own set of data releases that chiefly impact their own currencies. The following currencies are used widely in addition to US Dollar derivatives for news trading strategies:
- British Pound – GBP
- Japanese Yen – JPY
- Euro – EUR
- Australian Dollar – AUD
- Canadian Dollar – CAD
- New Zealand Dollar – NZD
- Norwegian Krona – NOK
- Swedish Krona – SEK
- Mexican Peso – MXN
- Turkish Lira – TRY
- South African Rand – ZAR
Several factors can weigh on the relevance of a news report: credit-, growth-, inflation- and interest rate cycles of an economy influence the sensitivity of single reports as well as macroeconomic news in general.
Cyclicity of News Events
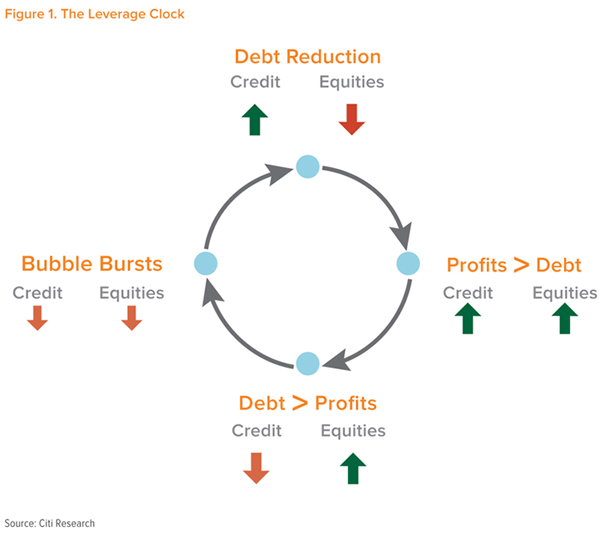
A credit cycle describes the availability of credit to borrowers. At low interest rates, credit is easier available and lending requirements are soft which increases the total amount of credit transactions. This credit expansion phase is followed by a phase of credit contraction in which lending requirements become more strict, interest rates rise and funds become less available to borrowers. Credit expansion starts again when credit lending institutions have reduced risks and start lending again. Expansion in credit is usually followed by increasing real estate and business valuations.
Certain economic indicators become more relevant in different phases of the cycle. Decreasing real estate values and rising interest rates can lead to higher sensitivity of housing-related news events such as US Housing Starts or US New Home Sales.
Increasing business valuations in times of credit expansion can make American and International Equity Indices prone to seizable reactions to US news.
Interest Rates
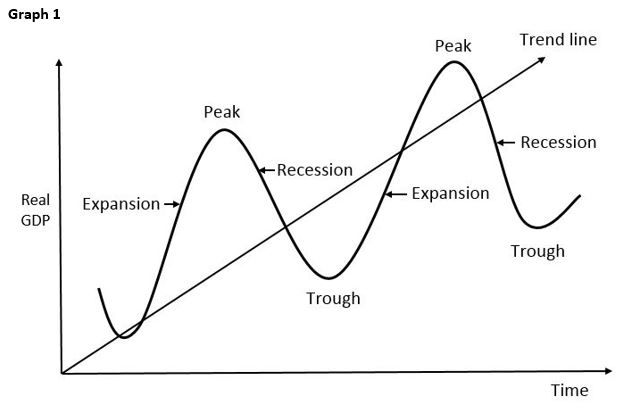
Interest rates tend to rise during a business cycle expansion and fall during contractions. Businesses get optimistic about future profits in times of economic expansions so that they invest in equipment and machinery by issuing more bonds.
More goods and services are being produced and people are investing more in the financial markets. If economic output is increasing and the economy growing investors prefer to buy assets with a variable interest. This way they can participate better in the growth of the economy. Money flows from Fixed Income products like government bonds to variable interest like stocks.
Bond prices move in the opposite direction of a bond’s interest rate and can be thought of just as another product or commodity: if prices are falling, it means that they are less scarce. If prices are high and thus interest rates on the bonds low, businesses are eager to issue as many bonds as they can due to the relative cheapness of credit.
The sensitivity of interest rates and the business cycle to market-moving data is in a constant shift, making some data relatively more important to other data depending on the phases of the interest rate and business cycles. News trading
For example, in a country where a change in the interest rate regime is likely, inflation data becomes more relevant than in those where the central bank does not plan to alter interest rates anytime soon.
Inflation
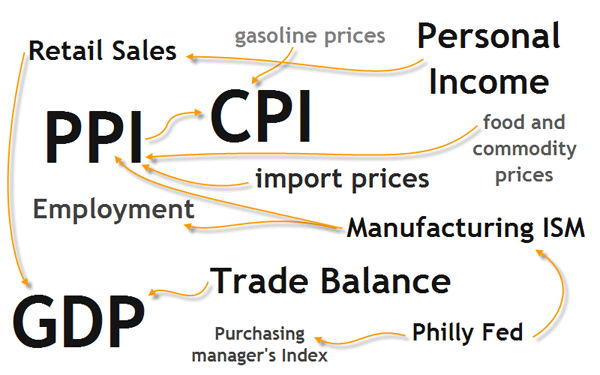
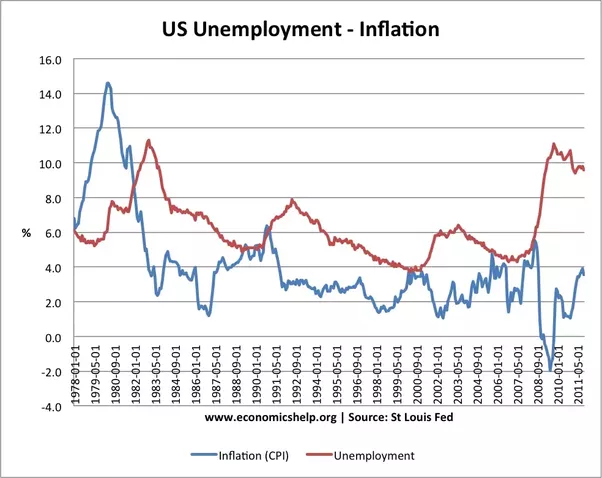
Economic growth and inflation are very closely interconnected. Inflation is the general increase in price levels for goods and services in a country and is measured in percentages. Popular indices to measure inflation are CPI (Consumer Price Inflation) and the PCE (Personal Consumption Expenditures) amongst others. There is usually a headline and a core version of each economic indicator: headline numbers reflect price changes of a broad set of goods (basket), while core number exclude highly volatile food and gasoline prices in order to give a clearer indication a price development in an economy.
Most major central banks of the industrialized world follow the policy of inflation rate targeting. That means they want inflation to move inside a certain range: most commonly they target an inflation band of about 2%.
What has been generally seen in the last decades have been phases with inflation above the 2% target followed by phases with lower than 2% inflation, either measured by the CPI or PCE. Central banks worldwide are very concerned about too high inflation due to several cases of either double-digit inflation or hyperinflation throughout the 20th century. More recently, the other notable worry is deflation that during the ’90s put a massive brake on the Japanese economy.
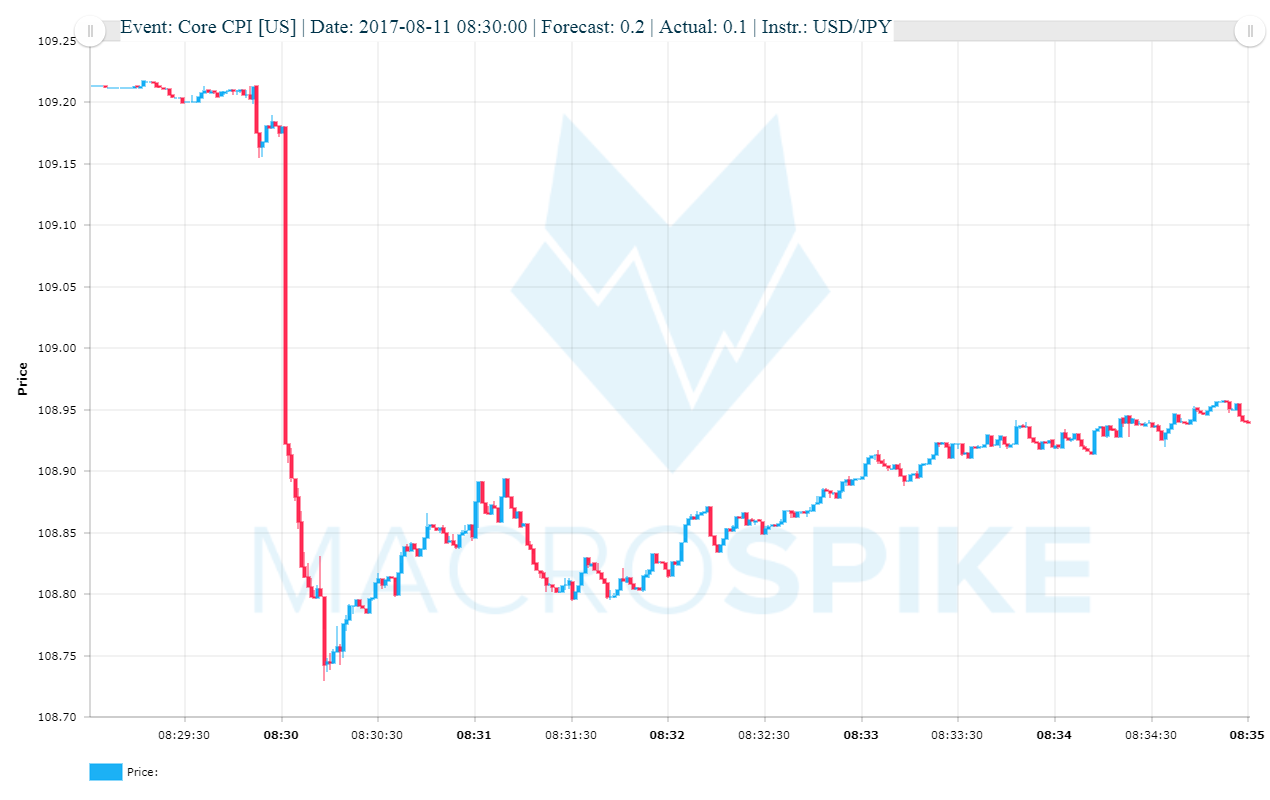
As mentioned earlier, the performance of the US Consumer Price Index as a tradable event varies alongside other economic news. Overall it has been reliable in giving above-average price spikes in the US Dollar, Gold Futures and notably Equity Index Futures with instant moves (within a few seconds) up to 150 points.
GDP
GDP (Gross Domestic Product) measures the total aggregate output of the US economy adjusted for inflation. As with inflation, neither too much nor too little GDP growth is healthy for the economy. If economic output is declining, businesses do not make enough profits to add value to the stock market. Too much growth, however, leads to an increase in inflation that will reduce profits by making money less valuable. Most economists agree that GDP growth of 2,5-4% is ideal, a band at which neither inflation nor unemployment should become a real drag on the economy.
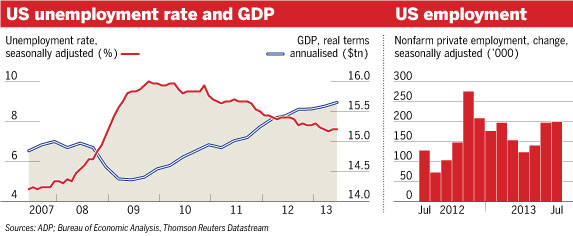
Studies have shown that each percentage point above 2,5% in GDP growth reduces unemployment by 0,5%. Low unemployment rates, which may sound positive at first, have shown to be a dangerous scenario in the past. Near-zero unemployment or full employment is generally considered costly because of two points:
- aggregate demand for goods and services increases faster than supply leading to rising general price levels
- wage growth as a higher input cost to businesses leads to higher prices for goods and services
Eventually, a stable balance must be found between inflation, GDP, and the unemployment rate to guarantee stable long-term economic growth as well as stable prices and employment.
Better or worse than expected readings on inflation, GDP and employment can have huge immediate and longer-term effects on price trends of various financial instruments. These numbers are so important for the global economy that no market participant can afford not to pay attention to them on an ongoing basis.
A REPORT’S BEHAVIOUR MAY CHANGE OVER TIME
Not only credit-, growth-, inflation- and interest rate cycles change a report’s behavior over time. Also central bank agendas, upcoming elections, and referendums can make certain news perform better or worse for an extended period of time.
For instance, shy ahead of an election or referendum, markets may not move at all even if the outcome of the news is surprising. On the other hand, smaller reports can become more relevant if a Central Bank decides to make them their agenda (eg. US Housing Data in the aftermath of the Financial Crisis).
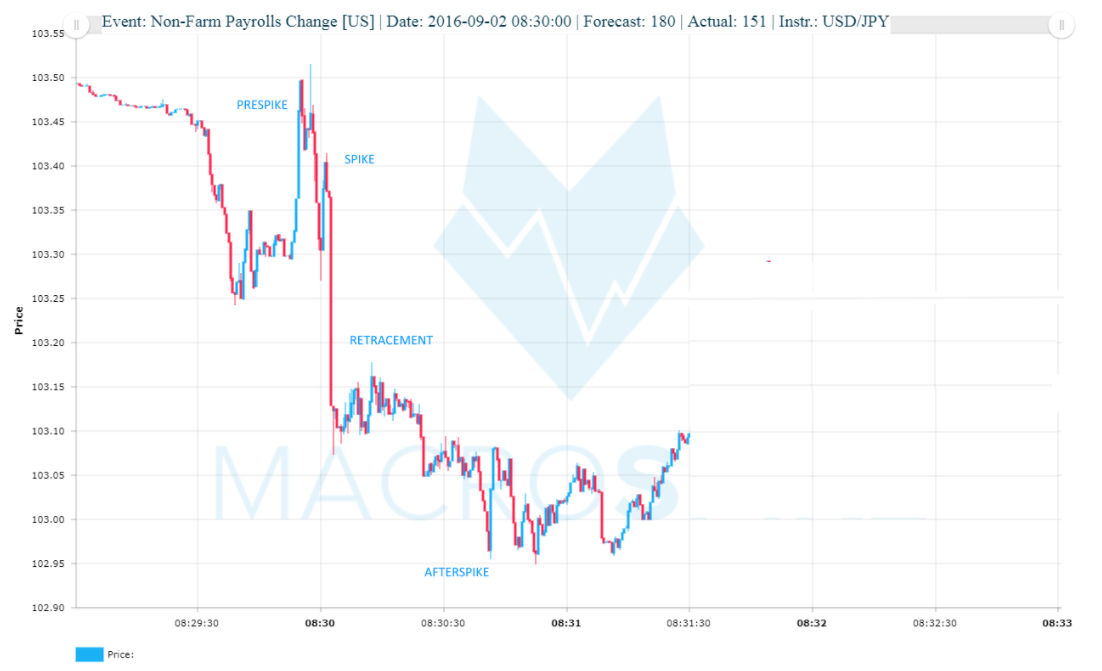
THE 4 SPIKE PHASES
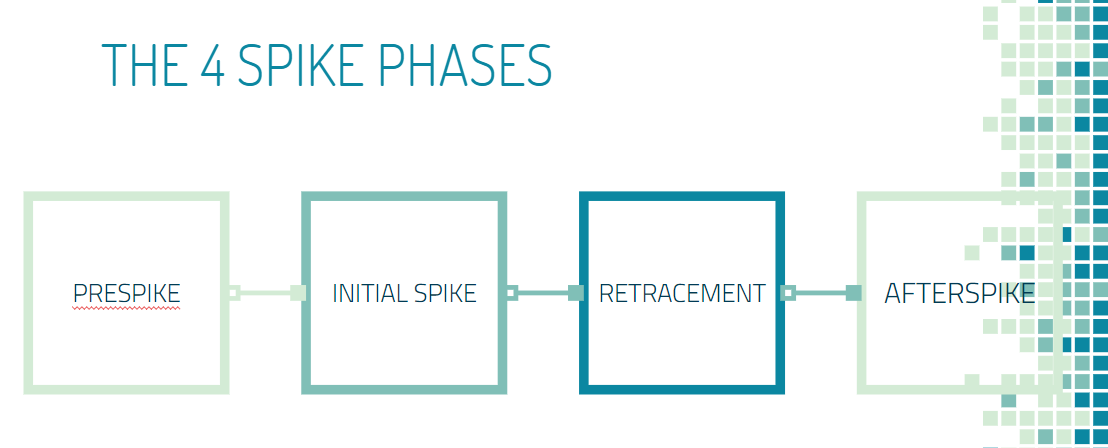
I. PRESPIKE
This refers to the immediate time slot before the publication of a macroeconomic news report. A major event can impact prices days or even weeks in advance since traders and investors that control large sums of money want to position themselves on time for future changes in the macroeconomic outlook.
The old saying Traders, as the saying goes, buy the rumor and sell the news. Traders should be alarmed at extreme price swings into one direction minutes or hours before an announcement: if prices get too stretched there may not be enough room for a decent reaction.
II. INITIAL SPIKE
Once economic data is published and distributed across financial news channels, market participants quickly digest freshly gained information.
Professional traders of market data, mainly HFT algorithms and other automated systems, now enter the market in the direction of the news.
If the event surprise level is sizeable, the volume will explode leading to a spike in prices of all underlying instruments and derivatives that are impacted by the news event. At the same time demand meets an still illiquid market on the other side. This results in an abrupt and clear market move – the initial spike. While the market moves it takes out stop orders sitting atop creating a self-enforcing reaction.
As uncertainty for market participants prevails during this spike phase, mainly illiquidity and bigger volatility, transaction costs remain high manifested by increases in the bid-ask-spread and unfavorable slippage.
III. RETRACEMENT
After the initial spike plays out, market participants face a new situation: Does the initial market reaction represent an adequate equilibrium? Or do prices need to advance/drop further?
The main question at this point is: Can the spike reinforce additional momentum and extend further?
With orders from initial spike traders all aligned in one direction, it can lead to a very crowded market with many traders unwilling to expose themselves to sizeable price swings.
If profit-taking from these short-term speculators and arbitrageurs outweighs the total size of new orders in the direction of the spike, the move will come to a halt. Traders aware of the overcrowdedness may start to fade the spike increasing counter-spike pressure.
At this stage the market is in a fragile position: The move must attract new buyers, pushing it further and taking out additional stops. If it fails to do so, too many people will become trapped at the end of the spike. The lack of upward momentum will then force the market to retrace from its initial reaction.
If the news release has a strong influence on the future fundamental outlook and is expected to lastingly impact order flows, the retracement usually represents a good time for higher volume traders to enter the market into the direction of the trend. Hence, the retracement becomes a purely technical move that is often followed by a continuation phase.
IV. AFTERSPIKE
While professional traders of the spike try to enter the market at the earliest possible stage, the ability of high-volume news trading algorithms to enter the market during the initial phase is limited. They need to wait for spreads to come down in order for their big orders to be released into a more liquid market.
Filling all orders can take from a few minutes up to several days or even weeks resulting in trending price moves into one direction until the fresh news is fully priced in and the market reaches a temporary equilibrium. While the initial spike move can be predicted with great certainty, the reach of the afterspike is harder to foresee. Other market forces work for or against it so that it can not be said with certainty where the new equilibrium will be reached.
He who knows when he can fight and when he cannot will be victorious.
Sun Tzu
News Trading Techniques
1. TRADING THE INITIAL SPIKE
This news trading technique is designed for very short-term timeframes. The goal is to capture parts of the initial spike and get out of the trade before a possible retracement sets in. This news trading strategy can be immensely profitable for news traders who know what to look out for. News Traders do not hold the trade for long. Therefore, great attention needs to be put on the entry and minimising transaction costs.
Only such spikes should be taken into consideration that have the following characteristics:
- Spike likely to last at least a few seconds
- Expected spread small in relation to expected spike size
- Big deviations from forecasts
Trades are held anywhere from 1 – 10 seconds.
FX BOLT and MacroTrader are both built for trading the initial spike.
Automated news trading systems like MacroTrader can identify slippage and put it into the context of the entire market move. This can vastly improve the trader’s ability to identify potential risks when news trading.

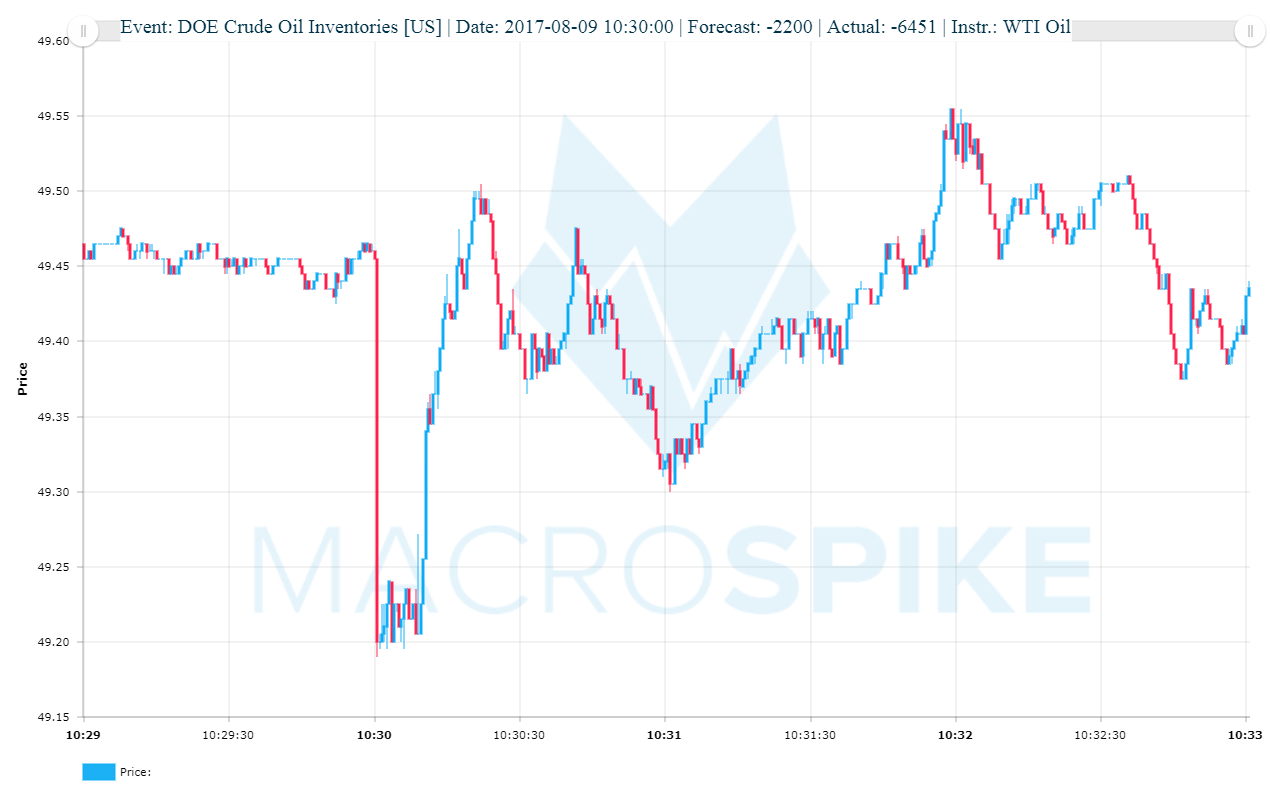
2. TRADING THE RETRACEMENT
Fading the initial spike can be a profitable endeavor. Traders with this news trading technique enter trades opposing the initial spike with the ultimate target at the start of the spike (or beyond).
3. TRADING THE AFTERSPIKE
This is the technique for ambitious news traders who want to score home runs in the investing game. Intermediate and long-term trades entered early have incredible profit potential with huge reward-to-risk ratios. Not seldom, a single piece of economic data can catch market participants off guard and cause markets to trend enduringly into one direction.
Trading the afterspike means trading in the direction of the initial spike and newly established prevailing market sentiment.
We have had a lot of big success stories with this news trading strategy. Afterspike news trading can compete with the big boys in this field. Digestion of new information often follows a specific time and price patterns.
4. THE STRADDLE
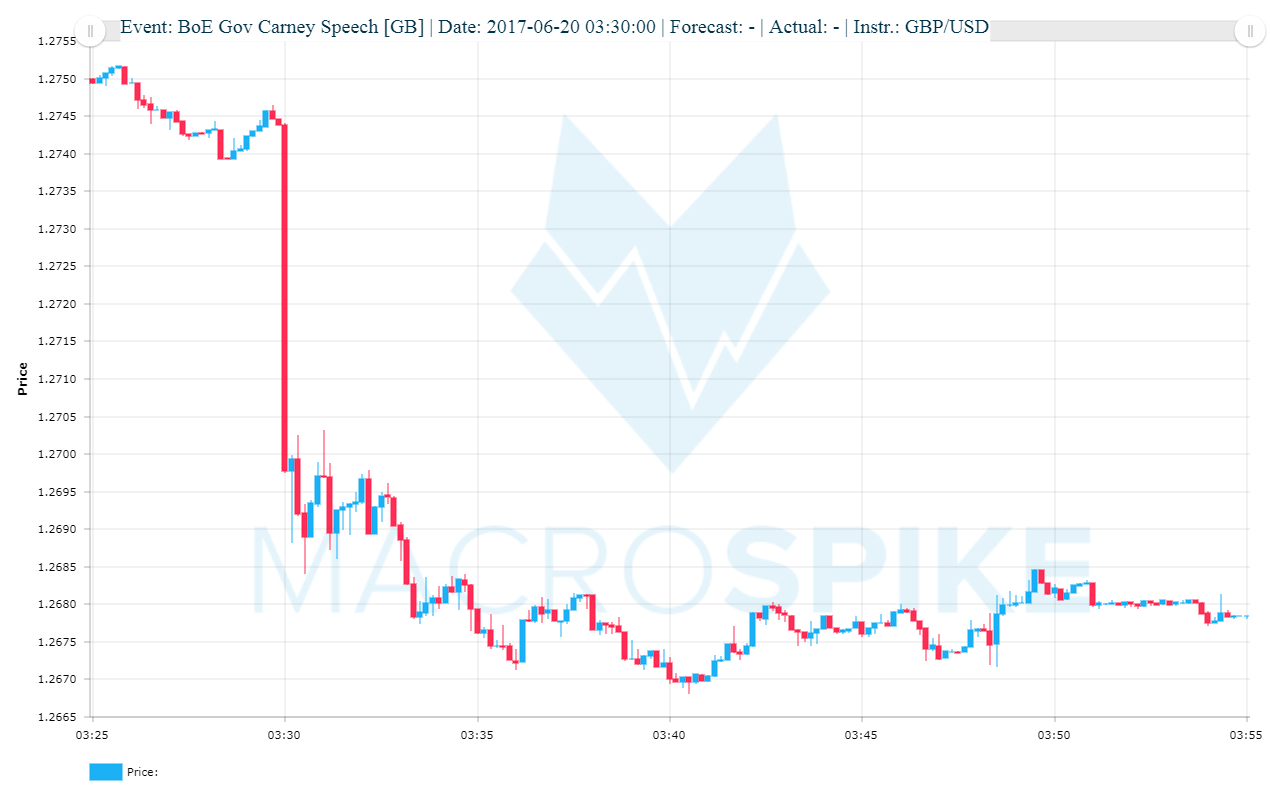
Straddling means placing two opposing stop orders in anticipation of speeches, elections, central bank decisions. Oftentimes, these are trades with very favorable risk-reward-ratios.
Below is the chart of Bank of England’s Governor Carney’s speech at 03:30 on the 20th of June 2017. GBP/USD tumbled 75 pips within 10 minutes. Notice how smooth and slow price distributed. There was ample liquidity, even for huge orders. It was virtually impossible to lose money on this trade.
Straddle trading is possible with our MacroStraddle strategy for Metatrader 4.
News trading is a complex endeavor. The volatility can kill many people who face events blind-sided. That said, believe that one should not ignore them, not even as a novice trader. Not technical indicator but macroeconomics are the true drivers of the financial markets. And understanding these trends, are vital steps in the direction of success in the trading world.
We hope you enjoyed this introduction to news trading and macroeconomic indicators. What did (didn’t) you like about it? Are there any points you would like to know more about in the future? We at MacroSpike News Trading would love to hear your comments.