
A Fade is a contrarian strategy where the trader sells into a momentum move of a prevailing trend in anticipation of a market turnaround.
In News Trading this means waiting for the initial move to settle and then opening a position against it.
Trading against the initial market reaction seems counterintuitive, so this article is dedicated to introducing traders to the concept of fading news events.
“Buy the rumour, sell the news”
One of the most recited trading proverbs stands for a fascinating concept in asset pricing dynamics. Beginner traders usually see asset prices as a reflection from present events. But truth is, rather than reflecting the present, prices constantly adapt to the probability of future outcomes. As a result, markets not reflect the present as much they represent the current pricing of future outcomes.
Let me give you an example: When traders are introduced to news trading, they are often stunned by the fact that currencies can sell-off after a central bank delivers an expected rate hike.
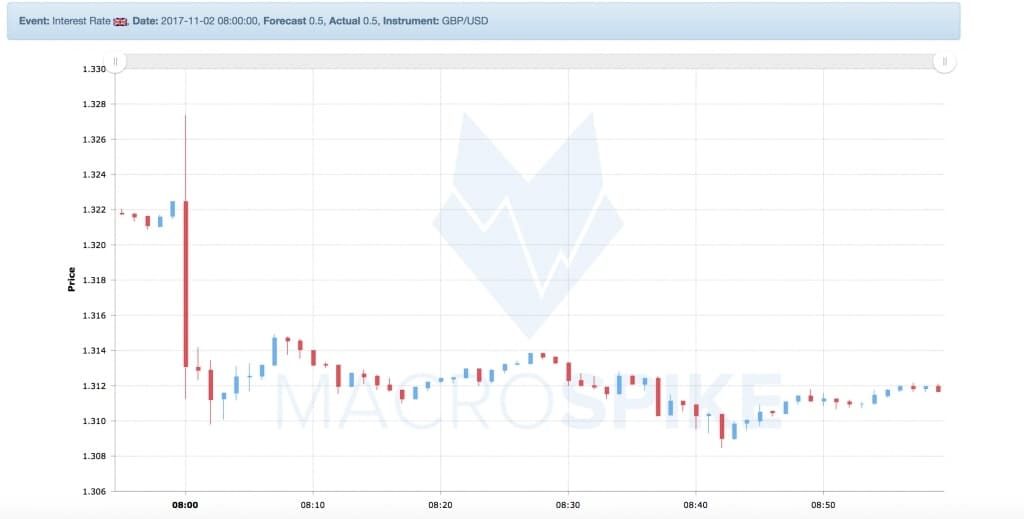
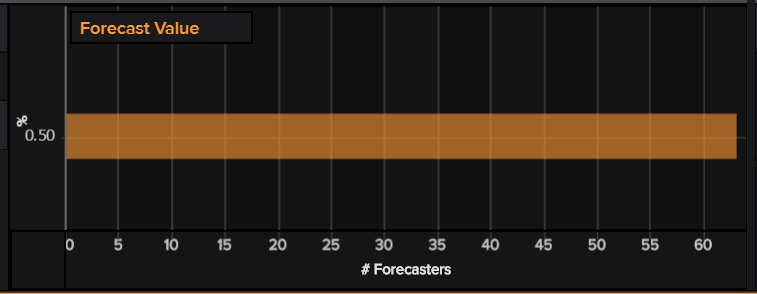
After a hike in interest rates by the BoE in November 2017, the Pound falls 150 pips against the Dollar. The table below shows that all 63 analysts polled expected the central bank to deliver the hike.
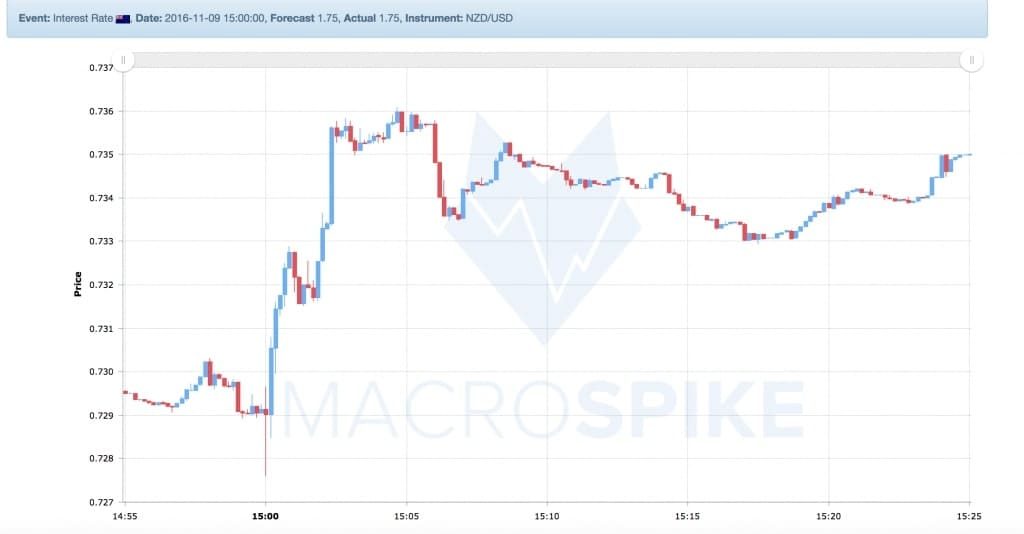
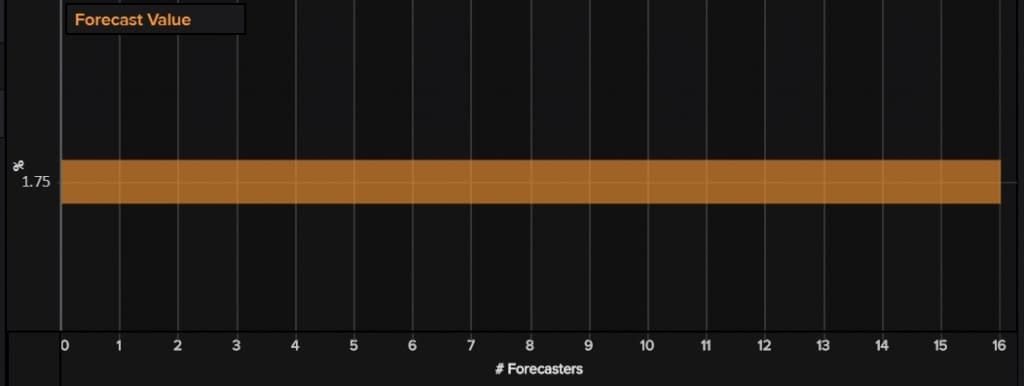
On Nov 9, 2016, the RBNZ announces a cut in interest rates from2 to 1.75%. However, NZD rises 70 pips after a rate cut that was vastly expected by all polled analysts.
Fascinating, right?
These movements often come as a shock to most market participants. Momentum traders are often caught blind-sided, first jumping onto the bandwagon becoming excited about the initial move, only to get crushed shortly after.
Though I’ve been trading the news for many years it took me long until I became comfortable with the idea of selling into a spike. The reason is simple: it requires a great understanding of what is currently going on in the markets, understanding the sentiment and, ultimately, having the guts to go against what seems to be a strongly trending move.
But why does an instrument go against its initial market reaction? What are these outcomes and how can I spot opportunities? This is what I want to outline in the coming article.
News events are very unique situations: They are scheduled moments where the expectations of a highly anticipated binary event meet the reality of actual data. In case expectations are one-sided, markets will previously move in the direction of the expected outcome. Prices will front-run the outcome of an event. That means the smart money will be already positioned. Thus, only the suckers are left to buy into the move. They provide the liquidity welcomed by those that were anticipating the event correctly and help them capitalize on their bet. Eventually, provides the trigger for the market to move against the new data. As a result – markets can sell off.
Complexity of Economic Indicators
News Trading would be a whole lot of easier if the interpretation of economic indicators would be as binary as many economic calendars make them seem to be.
Truth is, what the indicator stands for is a small statistic in a complex economy. And the interpretation for markets can be as complex as the economy itself.
Let’s look for example at employment data: While a rising employment number is good for growth rates of an economy and thus for companies, the removal of slack from the economy will put pressure on wages and impact the profitability of companies. This will drive up inflation and force the central bank to hike interest rates which make their stocks less attractive in comparison to Fixed Income Bonds. That will lead to outflows of liquidity from stocks into bonds.
The same data has both negative and positive implications for stock prices.
In the end, it’s a question of business and interest rate cycles what is the dominant driver at that point.
And often enough, you will find not only one but several indicators released simultaneously. They can result in conflicting information, too.
All of this creates uncertainty in markets, which in return results in choppy markets searching for their fair value.
Over the years of trading the news, I became more aware of this and began to search for opportunities beyond the usual one-dimensional trade entry.
Rather than looking at the momentum move and always searching for an opportunity to enter the trade in the direction of the trend, I also started to see spikes as great opportunity to sell into the trend at a very favourable price.
Of course, any contrarian strategy is a high-risk setup: trying to pick tops or bottoms can be a costly endeavour. However, over the last years, I found some events and patterns that are particularly prone to these fade setups.
In the next paragraph, I’d like to introduce you to some of the techniques I use to enter these trade.
Fade Strategies
Technical Fade: S/R-lines
Before a major event, I generally look at the chart and plot the major support and resistance levels. These can be previous High or lows, pivot points, Fibonacci Levels or whatever you desire. It comes down to what type of technical trader you are. Generally, I prefer to use price sensitive over time sensitive indicators, as they allow me to define my target levels at any time before the event.
The next step for me is to create scenarios about potential outcomes for the event and how they could impact prices and lead me into any of these levels. Historical data and spike ASRs (Average Spike Ranges) help me narrow down what to expect from the upcoming event.
If I can identify a major price level that lines up with my expected spike range, I define what I call a Fade Zone. This is the area where I expect the market to stop after the initial digestion of the data. Usually, the zone is price range that consists of a minimum and maximum value.
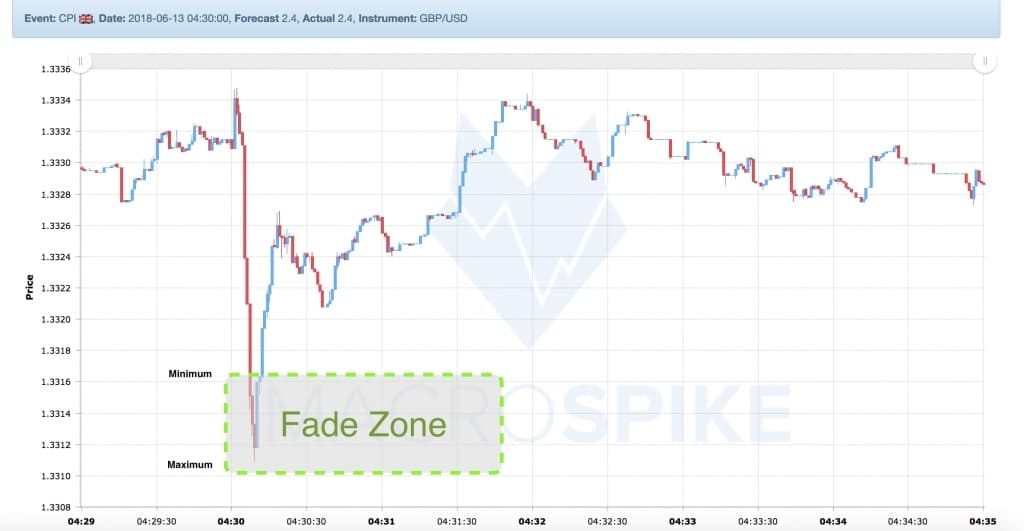
There are multiple ways of trading this strategy. Either you try to enter immediately after the initial reaction trade during the exhaustion phase against the spike. Usually, this is a quick trade. You enter in the first seconds after the release try to scalp out a few points. Targets are often retracement levels of the initial spike. I prefer to use our Fader EA for this type of strategy, as entries are often fast (3-10s after the initial reaction) and a very rigid money-management has to be applied in times when the volatility is so high.
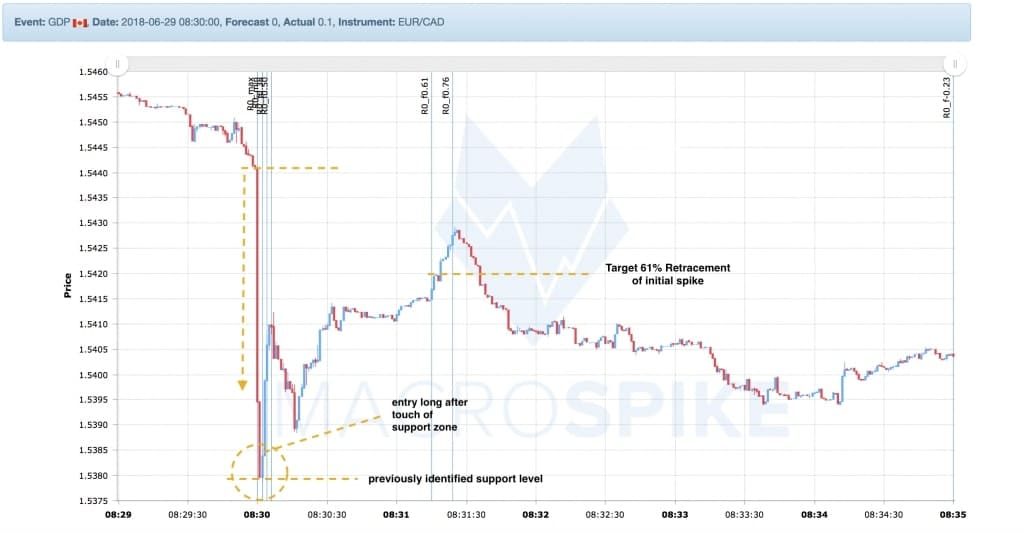
The other way is to wait for the market to allow a further extension of the spike and then expect the price to be taken too far that it gives the market to build fuel for a trend break. These trades usually don’t target the spike anymore and can often become intra-day trades with larger targets. Often, I prefer to trade these manually because I still don’t know what kind of dynamic the market follows in the aftermath of the event.
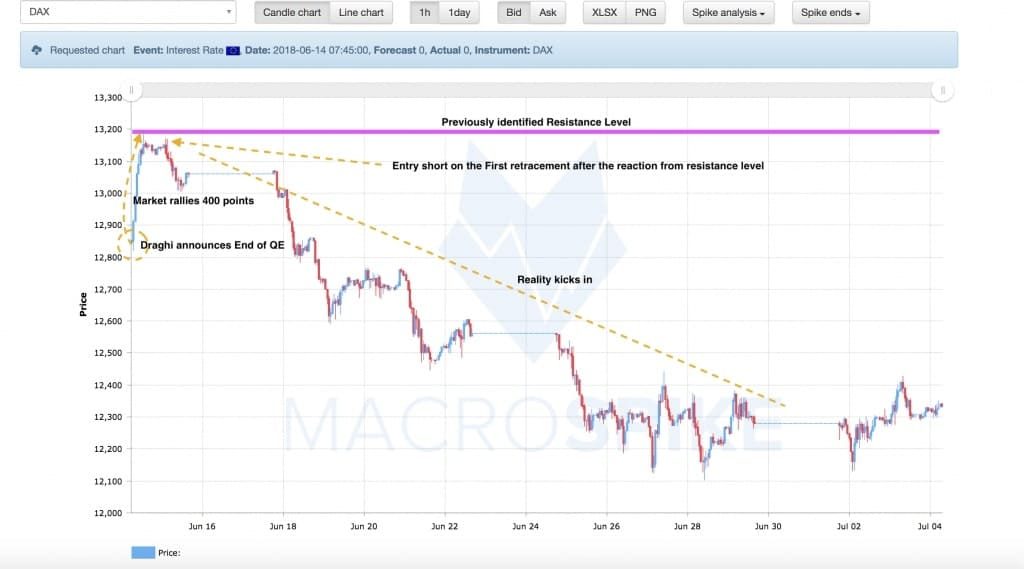
As you see, fading news events can be applied on any timeframe. While the volatility is the certainly the highest in the time that follows the release of the information, some fade plays can take hours or even days to play out. Generally speaking, the more complex the information, the longer it may take to play out.
It’s possible to create multiple Fade Zones and then define each with a separate risk level. However, keep in mind your overall exposure when doing so.
Summing up Technical Fade:
- Search for major S/R Levels that lie within the expected spike range
- enter the fade if the market fails to break support
- short-term fades are best opened algorithmically
- set Activate Time to 5-30s
- set MaxSpread to maximum a third of the average spike range
- The earlier your entry, the smaller Max R has to be. You’re looking at catching the top. If the market already retraced too much, the opportunity is gone. Don’t trade MaxR >20% with this approach.
- stop 15-30% of the spike
- target 50-100% of the spike
- protect your position by adjusting SL if markets find strong support at critical retracement levels and it looks to turn into a retracement trade
- intra-day fade trade: best entered manually
- let the momentum play out and wait for the market to hit a major support
- switch to a smaller timeframe and wait for the break in trend there
- take the first signal after the trend break
Fading Average Spike Range (ASR)
On some trades, I like to focus on the spike range and try to fade the move if a certain outcome (ie a conflict or low deviation) sets in. Price levels play a lesser role here, though I always like to know where important support and resistance levels are, to be wary of potential stop runs. Instead, I look at the odds of a trade reversing if it hits a certain spike size over a set timeframe. Economic news tends to follow patterns even if the data of the release is conflicting.
Let’s look at the DOE Crude Oil Inventories, one of my favourite events to use for fade plays. This is a rather complex release, containing several indicators that are all released simultaneously. It is very complex and Crude Oil markets are usually very volatile in the aftermath of the data.
MacroSpike has their proprietary and very successful method to calculate trading signals. And we like to use situations of conflict to our advantage that offer good odds of a strong reversal.
The next picture shows average spike data for the DOE Crude Oil Inventories over the last 6 months. This data can be accessed through the MacroSpike Analytics web-app, which will be available for our customers in a few weeks.

What is striking here is the fact that on average, the Crude Oil spike retraced 17% in the first 5 and 44% in the first 15s. While it alone can’t be used to build the strategy, I like to use the data to support my trading setups.
Summing up Spike Average Range Fade:
- Look at historical spike data giving, putting more emphasis on the latest reports
- MacroSpike’s Afterspike App help in determining ASR data
- Price Level analysis can be complimentary
The first examples are two concepts that build the base for all other examples that follow: Either you use price levels and ultimately technical analysis to define your fade zone. Or you use ASR data in order to set your fade zone. Both concepts can be complimentary and, needless to say, an overlap of the two provides a stronger resistance level.
Anti-Correlation // Divergence Trade // Trading conflicts
Anti-Correlation
As I’ve previously mentioned certain data points can have conflicting implications for themselves. Sometimes stocks rise on good unemployment data, sometimes they fall. The impact changes depending on where you are in the business cycle (For those who want a more detailed analysis, I recommend this working paper).
There are times in the business cycle where events are particularly conflicting, while there interpretation is one-sided at others. But cycle changes are slow enough to build reliable strategies based upon that information.
As our members know, I’ve been speaking a lot about the fascinating relationship between USDJPY and equity indices. The Yen is the main funding currency for most institutional investors in the world, thanks to the negative interest rate policy (NIRP) the Bank of Japan has implemented over many years. Thus, worldwide risk assets like US indices have a high correlation with the Japanese Currency. In a market phase where participants see the Fed falling behind the curve, an interesting correlation takes place during the release of positive inflation indicators.
On one hand, we witness Dollar buying pressure as trader flock into USD on expectations of higher interest rates. On the other, fears of higher interest rates result in investors unwinding some of their risk exposure. These outflows lead to JPY strength. The USDJPY pair can get caught up in between these two forces. As a result, the pair gets pretty choppy. Let’s look at some examples of the Jobs Report over the last few months:
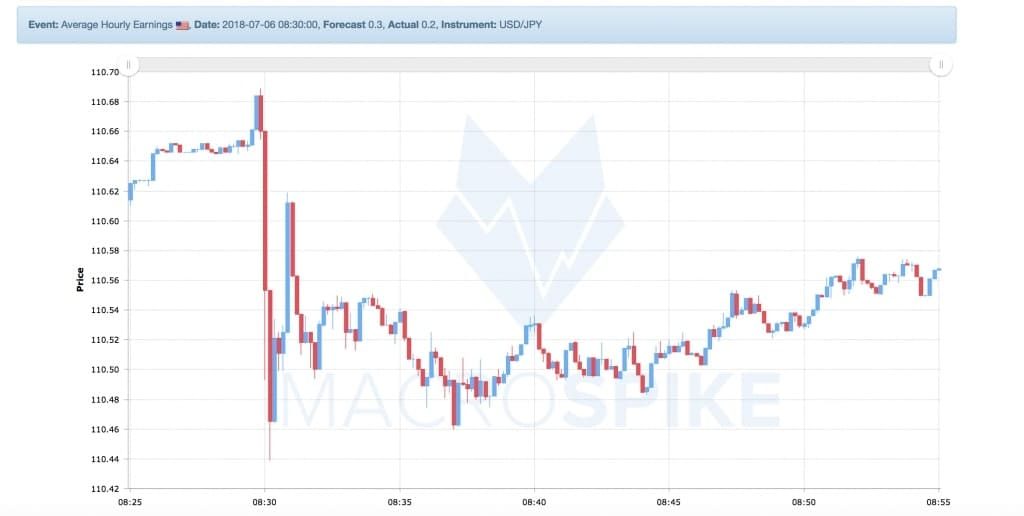
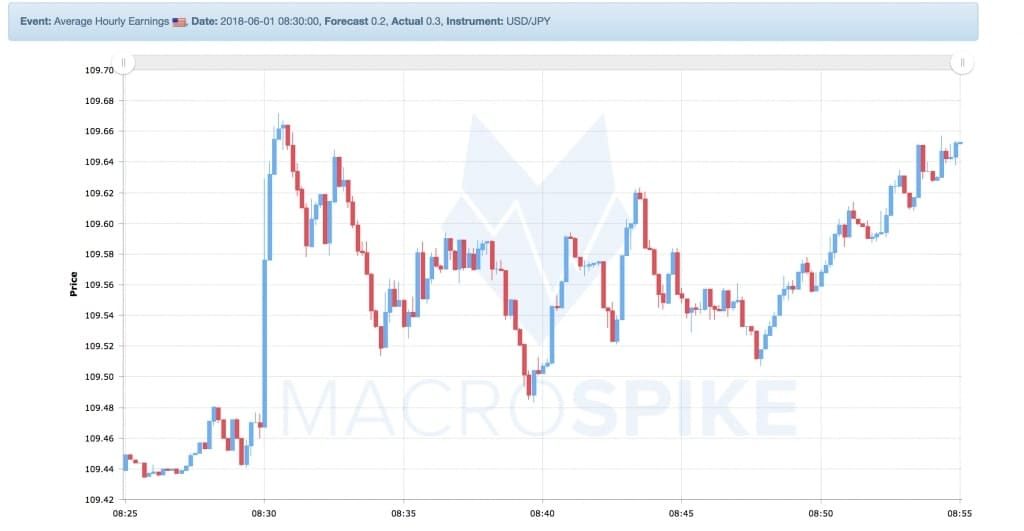

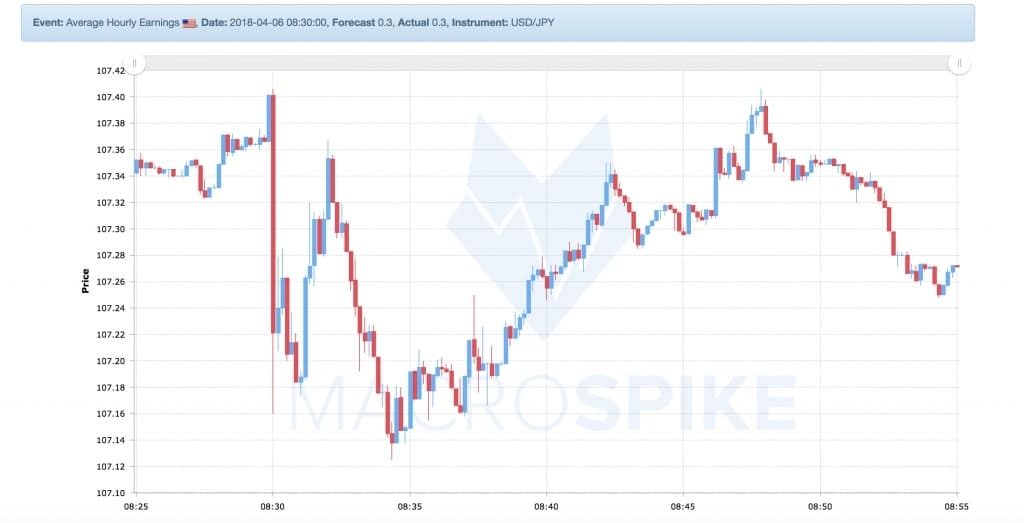
As you can see, during the last 4 releases the Dollar-Yen pair retraced between 50-80% during the first 90s in all cases. The maximum spike usually took place between the first 10-15s. While none of these moves is extraordinarily big, they offer great scalping opportunity with a high probability entry for the aware trader.
Summing up Anti-Correlation Fade:
- Entry trigger is the reaching the minimum spike range of an instrument where the report’s data gives both buy and sell cases for the instrument
- Can be only played during certain market phases
- short-term entries, best entered algorithmically
- You’re trying to catch a top, though being early is not a disaster, due to the high probability of a market turnaround
- This setup usually uses spike sizes as trade entry trigger. I don’t recommend using too much historical data to define spike ranges as your strategy is usually cycle-dependent.
- Set Activate time to 5-90s
- If you’re too early and the market keeps falling, do not to close if the market goes against you: you have a SL for that. However, don’t hesitate to close the position at the first spike into a 50 or 61%, even though you may suffer a small loss.
- Set a low MaxR level 10-15%
- Set the %SL to 15-25% and to min 10pips and max 25.
- the spikes are usually not extraordinarily big, so using a broker with tight spread during news time is even more important.
Divergences
Trading Divergences is similar, only that you use the divergence of two usually highly correlated instruments as trade entry trigger. You need to watch several instruments following a release. You may take two opposing trades on the instruments as the divergence reaches a point that seems profitable. But I prefer to identify the odd one in the room and then search for an entry there.
The January 2018 US Core CPI release saw monthly core inflation rise by 0.3%, 0.1% stronger than median expectations. Interest Rates reacted particularly strong on this release and 30Y-Bonds sold off 60 ticks in the first minute. The first reaction on the Dow Jones was muted, but it showed a positive correlation with the move in Interest Rate. Meanwhile, the German Dax did not get the message immediately and remained correlated with the falling EUR at first.
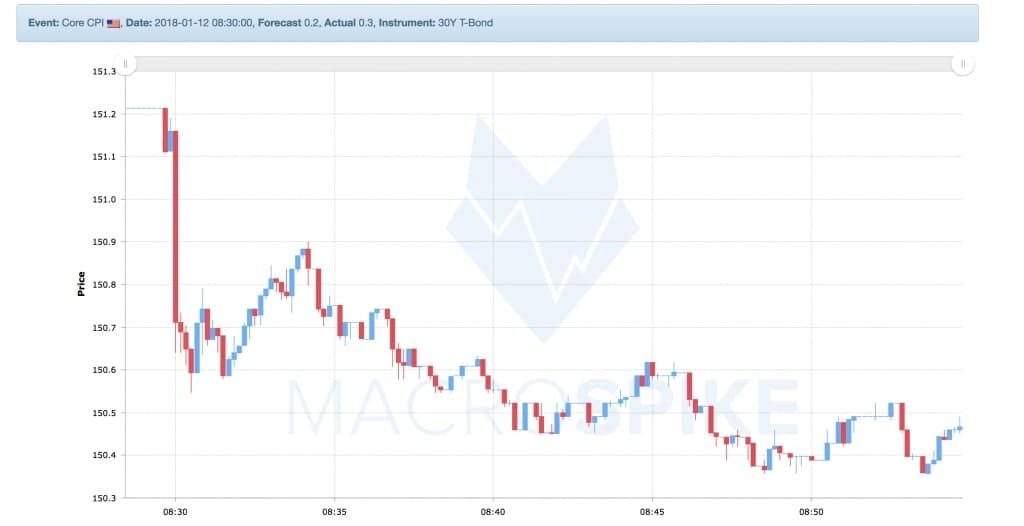
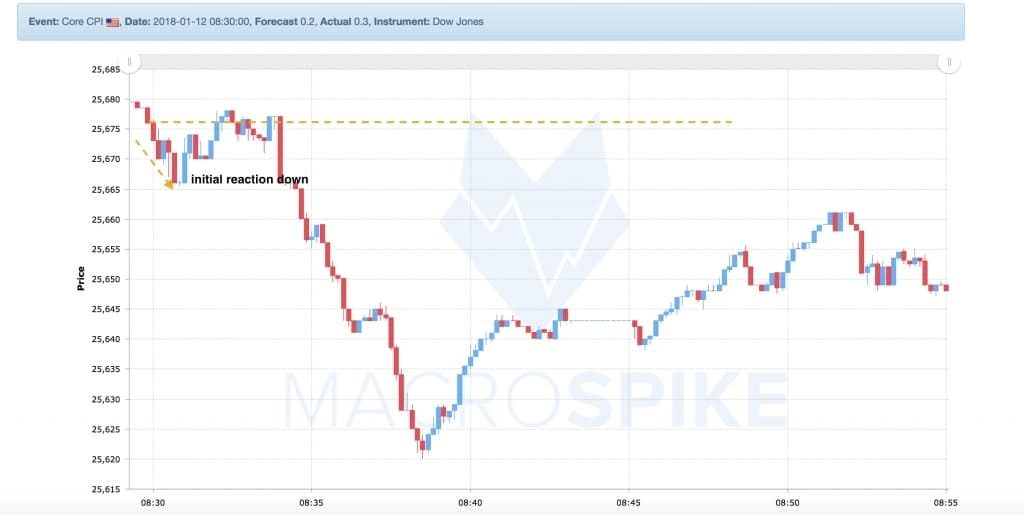
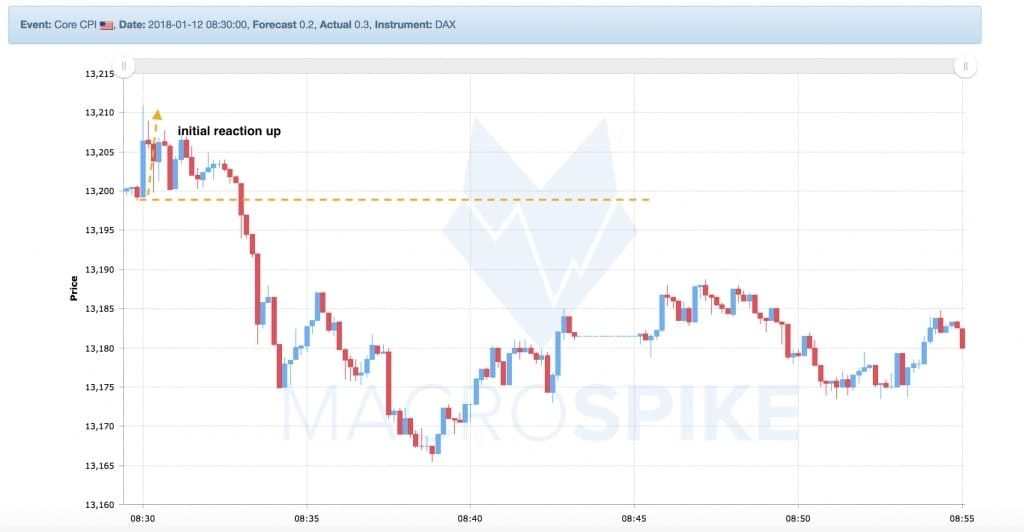
However, this divergence did not last long and a few minutes into the event the DAX was dragged lower alongside the Dow. In the end, higher rates put more pressure on it, as the weaker EUR could on the German Index.
Foreign indices are usually an interesting instrument for fade plays, in particular when trading US data.
Trading correlation divergences can be a great way to identify fading opportunities. However, reading the market sentiment correctly requires experience and a profound knowledge of the potential impact of certain economic indicators.
Summing up Correlation Divergences:
- Entry trigger is the divergence of two usually highly correlated instruments
- best entered manually
- can be traded on multiple timeframes
- you can open two positions on diverging instruments or trade only one of the instruments
- if you spot a divergence and feel that it is overextended (the definition depends on the timeframe), wait for the first signs of exhaustion and enter the fade in the opposite direction
Conflicts
Conflicts are another great trigger to enter into a fade play on multi-indicator reports. As I’ve mentioned before, the more indicators are released at the same time, the higher the chances for a conflict. While the market initially reacts to the main indicator, it sets up for a great fade play.
Here’s an example of the Canadian GDP data.
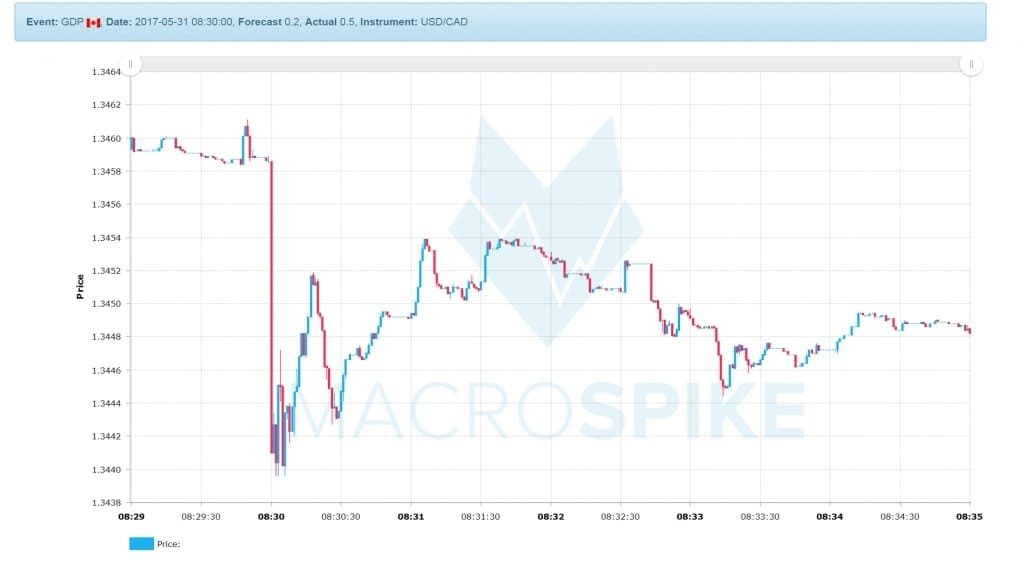

USDCAD retraces sharply after monthly data conflicts strongly with the annualized quarterly indicator +0.3 vs -0.5.
Be careful though: not every conflict sets up for a fade play. Some indicators are more relevant than others and a conflict between weak and strong performing indicator should not exclusively be seen as a reason to enter a fade play.
Summing up conflict trades:
- Entry trigger is the conflict between two main indicators of a report
- ideally, this trade is entered automatically
- try to enter the trade at the earliest possible stage (2-5s after the data release)
- the spike will likely be muted, thus MaxSpread should be no more than a quarter of the ASR
- targets can be 61-100% of the spike
- SL 20-30%, but at least 10 pips
The Squeeze
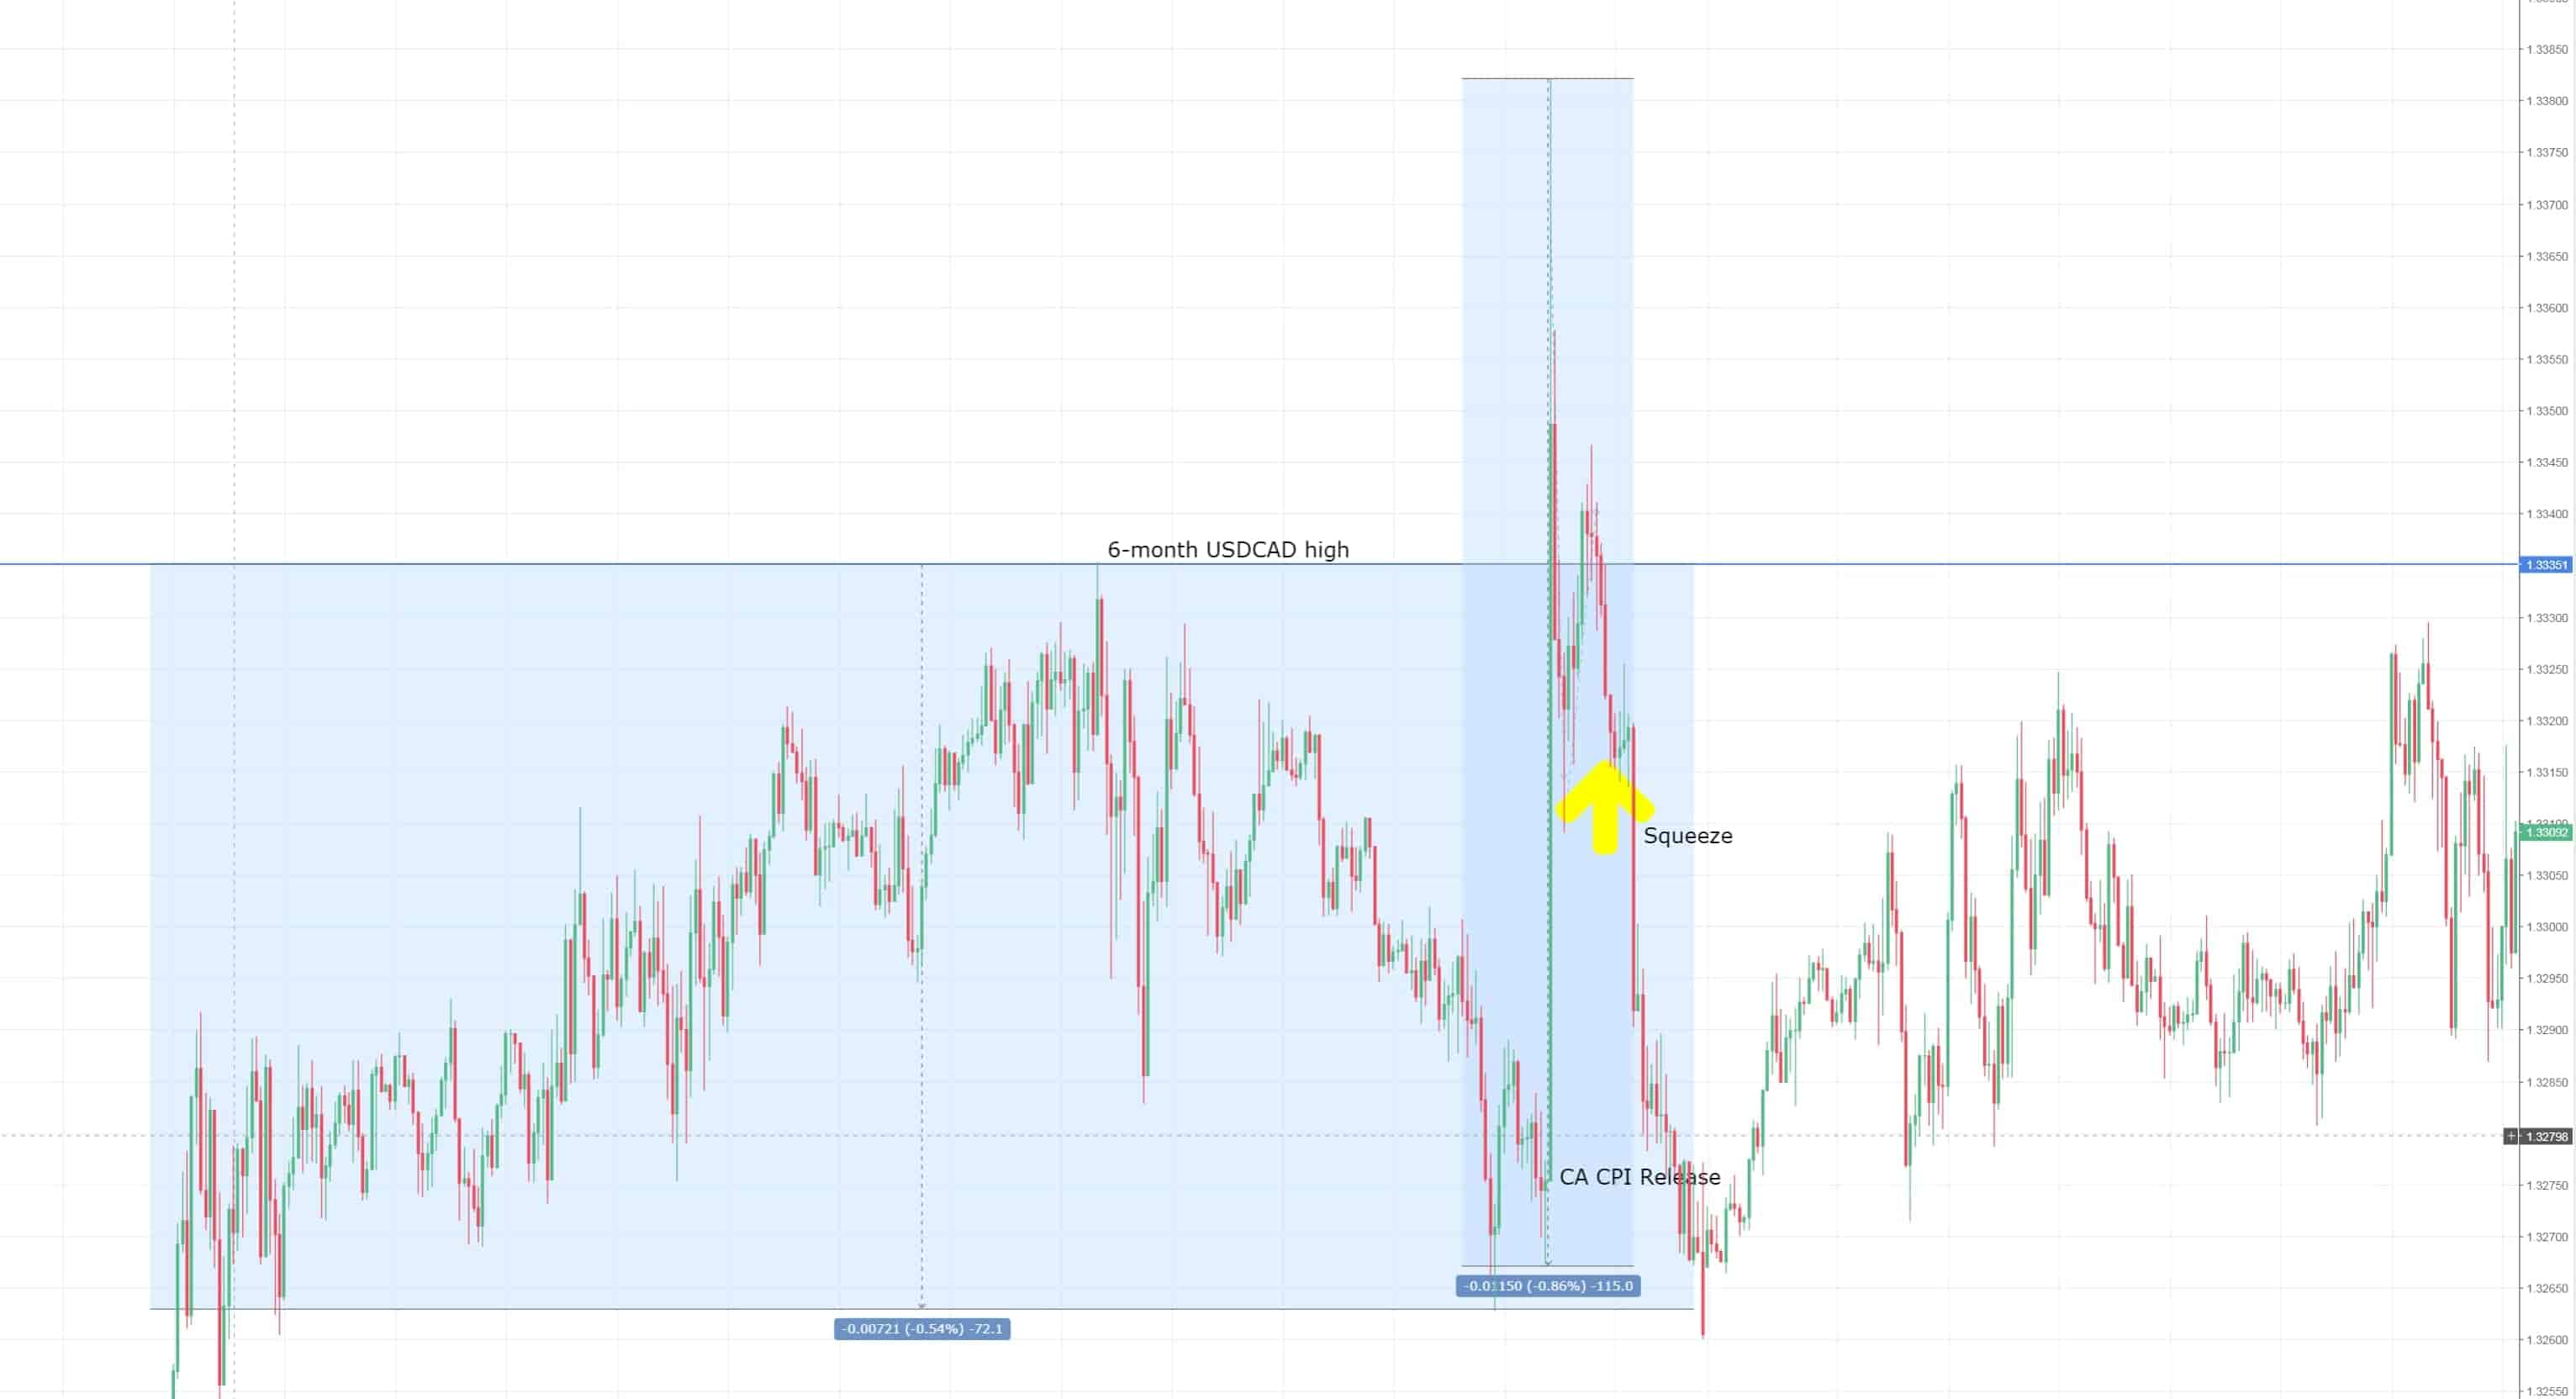
The Squeeze is another strategy I like to use for fading spikes. While previous ones mostly revolved around trading conflicts, this is primarily a price action approach. The idea is to take advantage of an event-driven squeeze move that results in massive bull or bear traps.
A breakout from an important price level often results squeezes taking out SL orders that were sitting above that level. Once a news hits the wires it produces sudden pressure and takes out a lot of orders at once. Since stop orders are market orders, they can push prices past critical levels with no respect for any price whatsoever. As a result, these self-enforcing moves results in huge initial spikes that can vastly overextend. With many people forced out of their positions and the market strongly overbought, these become great opportunities to sell into the spike. Let’s look at an example:
On the 22.06.2018 StatCan released the monthly CPI data for the Canadian economy. With the BoC being in a “highly data-dependent mode” markets where strongly anticipating that release. USDCAD had been trading in a 70 pips range at 6-months highs for the entire week. As we moved into the event, it was just nearing the lower end of the range.
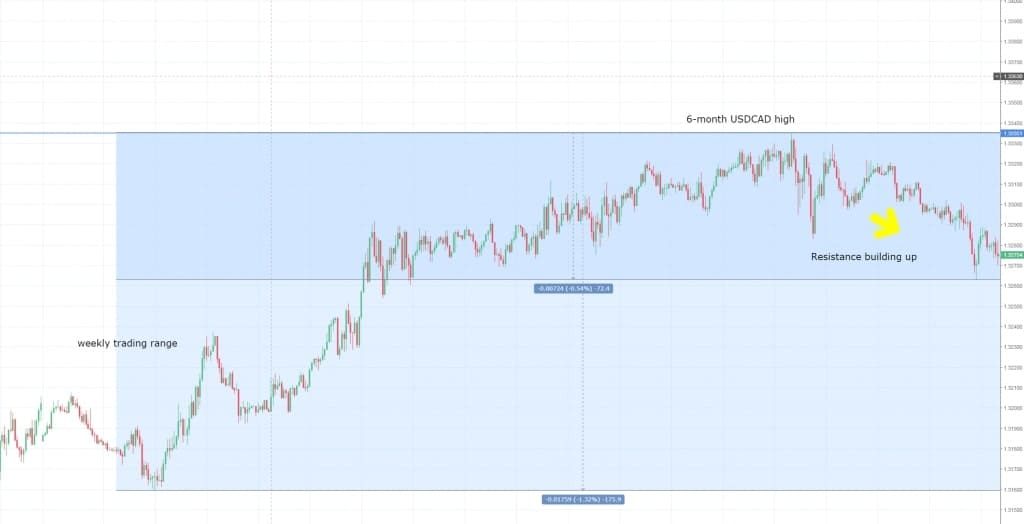
Median expectations stood at a monthly growth of 0.4%. But the data came out at shocked market participants with only a mere 0.1% growth rate.
The Canadian Dollar sold off strongly against the USD. While the deviation was significant, the breakout triggered a massive squeeze in USDCAD short positions. Within 10s markets had shot up over a 100 pips and broke out of the range making a new 6-months high. Prices got taken far beyond their fair value and generated what can be called a classic Bull-Trap for those buying into the spike.

This is a typical, in fact, one of the most important setups in news trading. Important, because it offers one of the best Risk-Reward Ratios (100+ % of the initial spike) with unlimited scalability if you recognize it correctly.
Summing up the Squeeze:
- Entry trigger is rapid stop run, resulting in a massive price overextension
- tradeable manually and algorithmically
- search for an instrument at a critical S/R level
- if the event triggers a stop run, the market will generally squeeze for 1-10s until it reaches first exhaustion
- For automatic entries
- High Min Entry, at least 1.5 times the average spike range
- No need to set a Max Entry: the higher the initial spike, the stronger the reversal
- if you use price levels for entry levels, search for big S/R levels, such as weekly or monthly levels. Often, big orders are sitting there waiting to be executed.
Last Thoughts
There are a number of ways how to enter into a fade play. I’ve described a few here briefly that I use but I am sure, there are much more options. These techniques have been described from a personal viewpoint of a trader, who usually dislikes the use of wide stops and in return accepts to lose while being right in the end. Depending on what type of trader you are and how you approach risk, some of them may suit you better and others may have to be adjusted to your trading style. Many of them can be combined to increase your chances for a successful trade entry.
Nevertheless, choose your trades carefully. Trying to pick tops can be costly in such a volatile environment. You are going against the trend, in what usually is a strongly trending move. I’ve found this strategy to be suitable to my trading style, but I don’t think it is something for everyone. I can only recommend to employ a very rigid money management and not hesitate to accept that you’ve been wrong. In particular, traders who have problems acknowledging their mistakes and tend to hang onto their trades for too long should be careful when applying the strategies presented in this article.
That said, our software MacroTrader offers an in-built Expert Advisor for automated fade trading. It can help you overcome the problems of money management and navigate you effectively through the volatile times of the afterspike phase. If you are interested, please check it out. As I’ve explained, trading algorithmically has a variety of advantages when trading during fast markets. Additionally, it not only offers trading algorithms to fade the news but to trade in the direction of the spike, like straddling or trading retracements.
That is our guide for fade trading economic news – I hope you learned something. What are your experiences with fading the news spike? Do you employ other setups when fading economic data? Please let us know in the comment section and I am happy to enter into a