Sometimes it easier to understand concepts with the help of visualization. Thus, I made this compilation of charts showing many recent trade setups along with many pips earned.
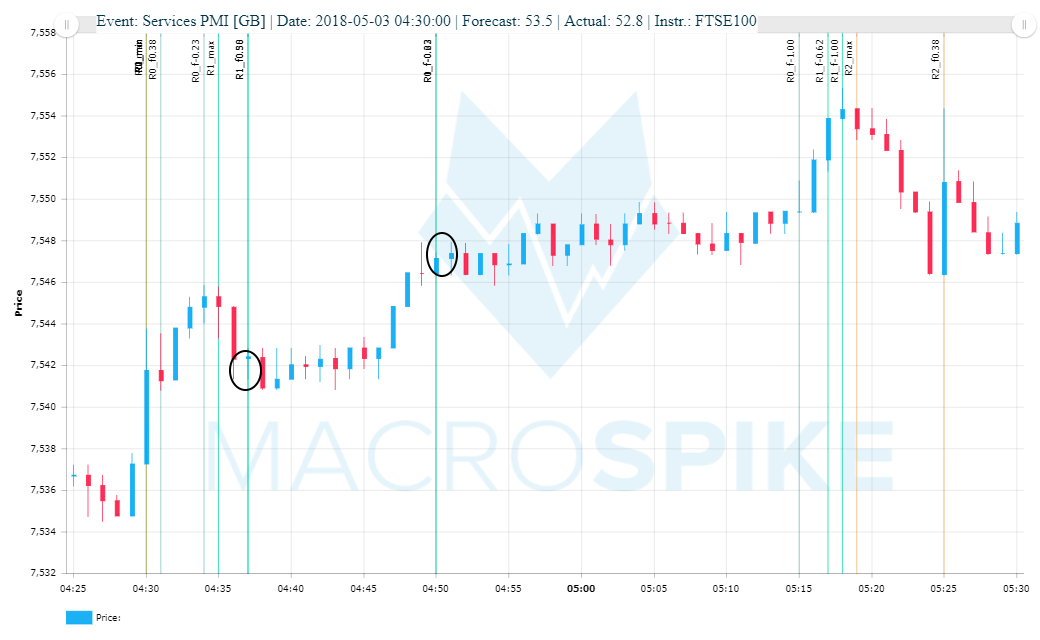
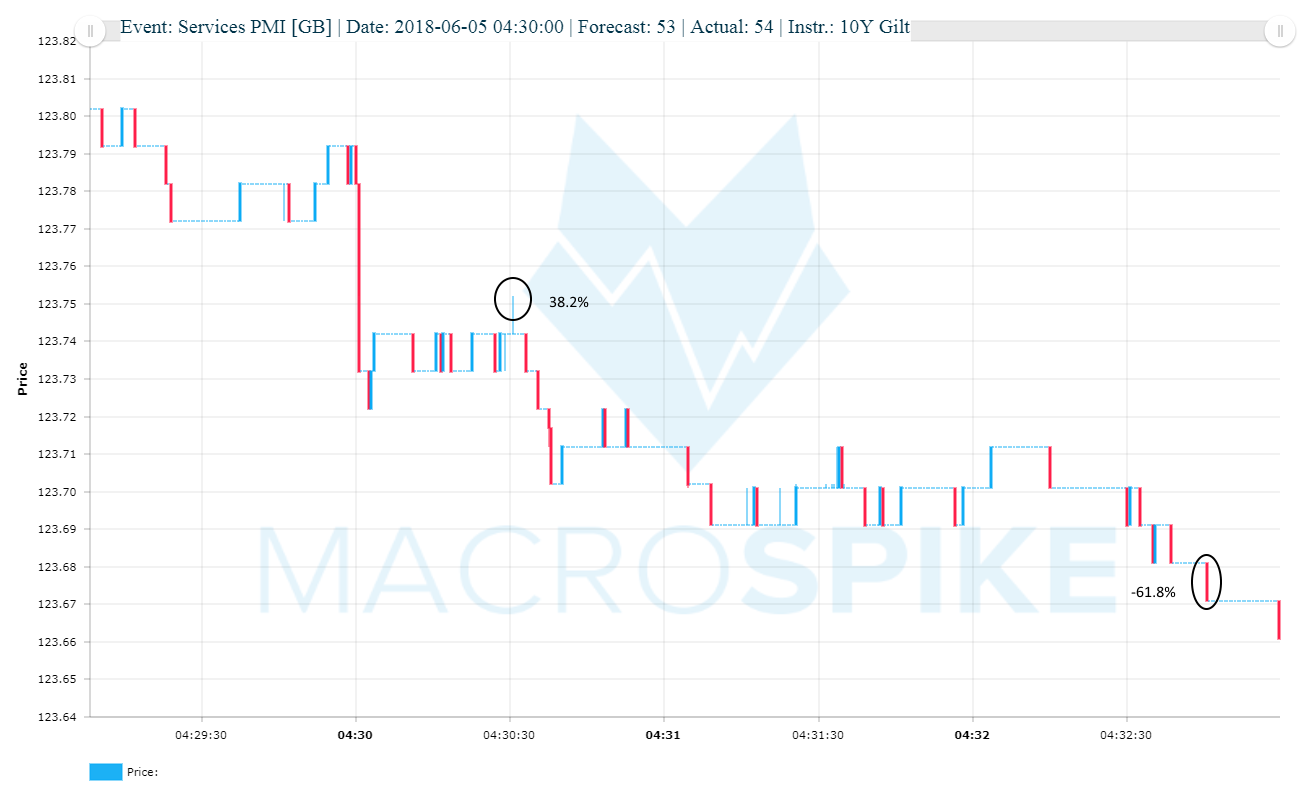
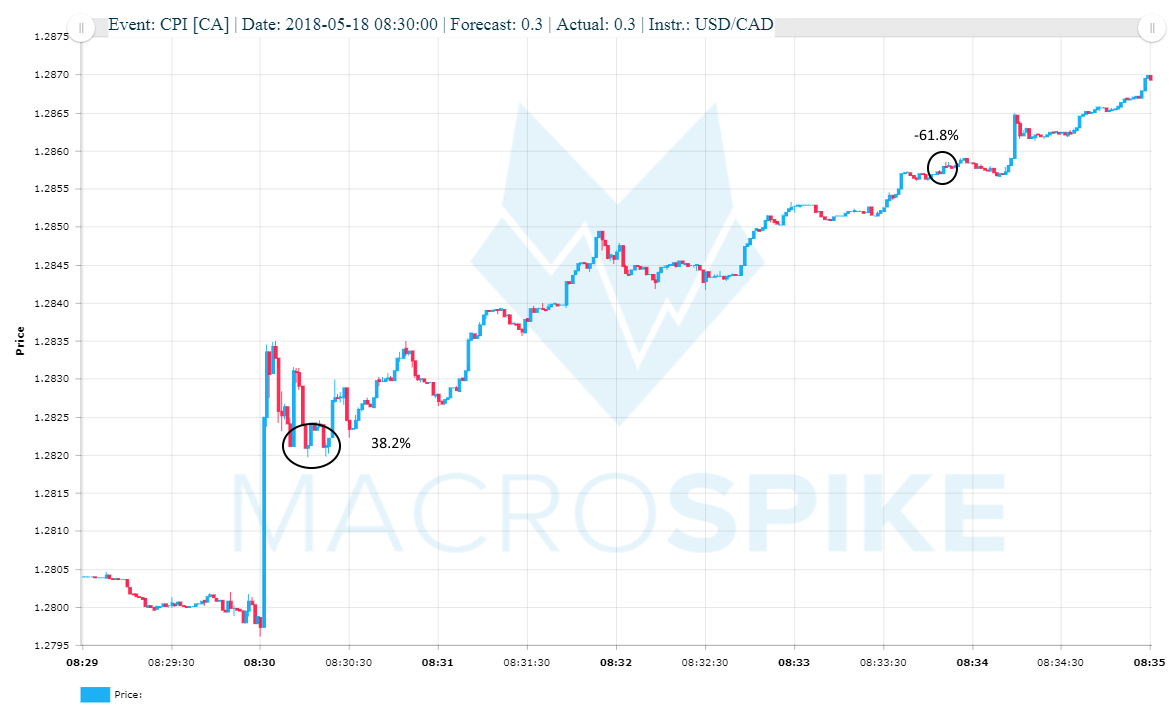
The 38.2% / -61.8% Spike Continuation Trade
The setup: A news-driven spike retraces 38.2% from highs/lows, then reaches the -61.8% target.
![](/wp-content/uploads/2018/06/2018-06-05_04_30_00_GB_Services_PMI_GBP_USD_duka_GBP_USD_-2.png)
![](/wp-content/uploads/2018/06/38.261.8.png)
![](/wp-content/uploads/2018/06/382618.png)
![](/wp-content/uploads/2018/06/2018-05-03_04_30_00_GB_Services_PMI_10Y_Gilt_oanda_10Y_Gilt_.png)
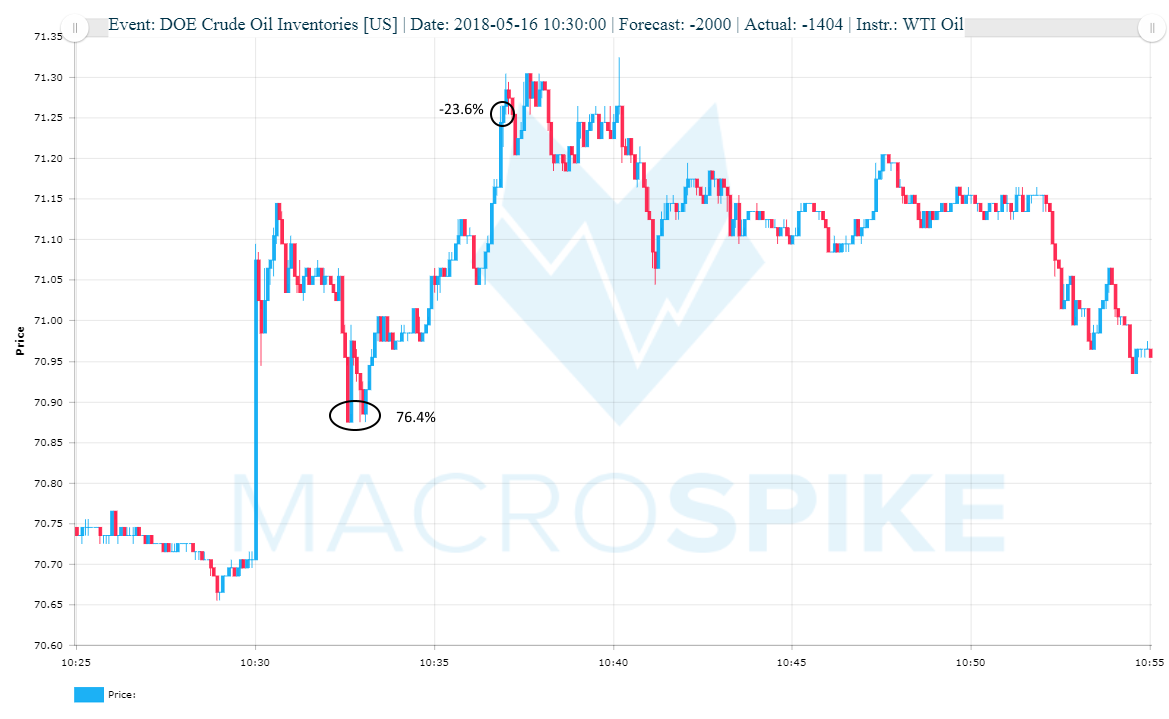
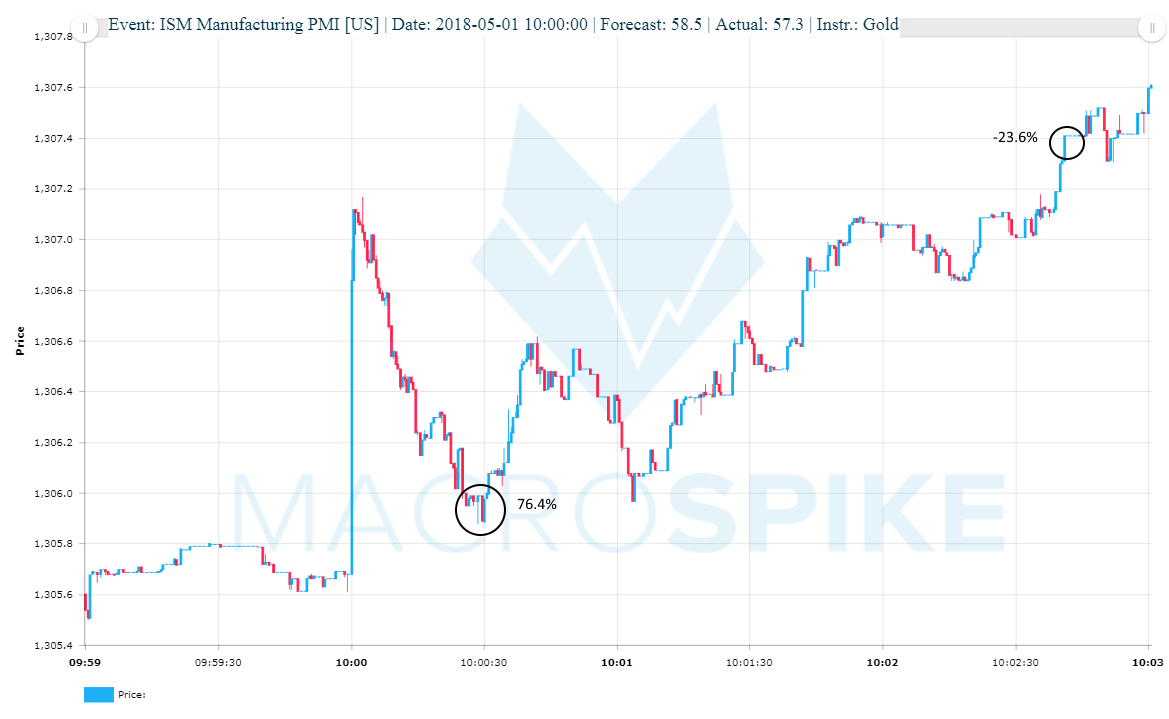
The 76.4% / -23.6% Spike Continuation Trade
The setup: A news-driven spike retraces 76.4% from highs/lows, then reaches the -23.6% target.
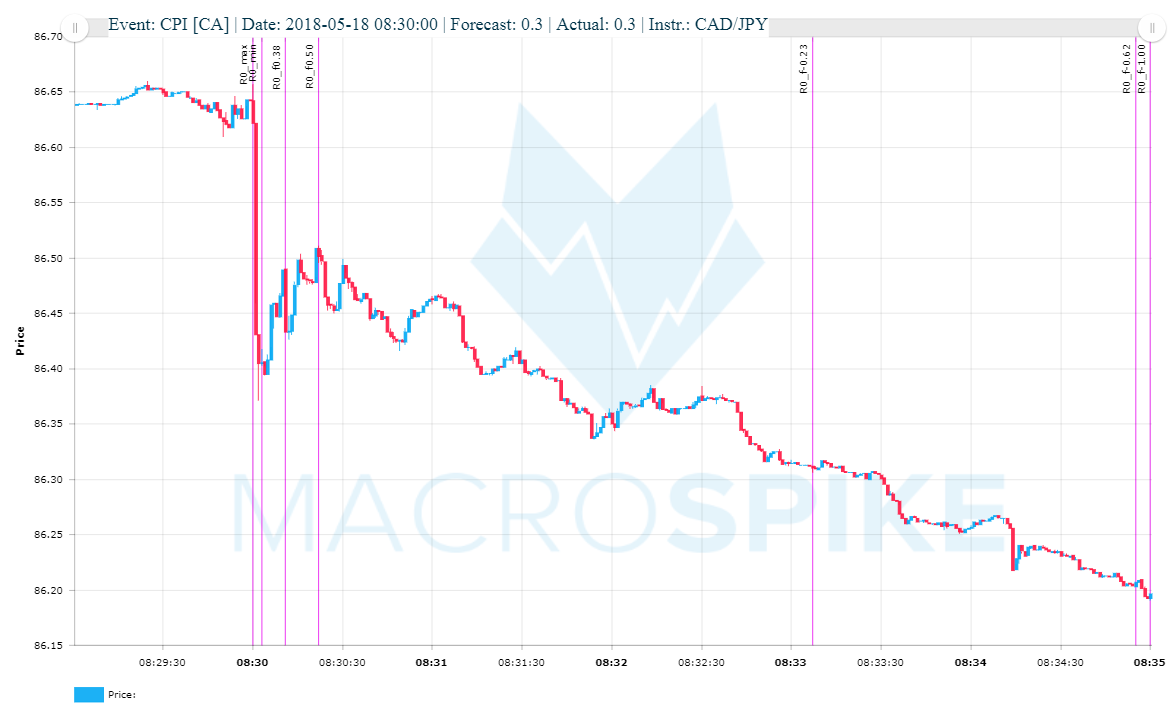
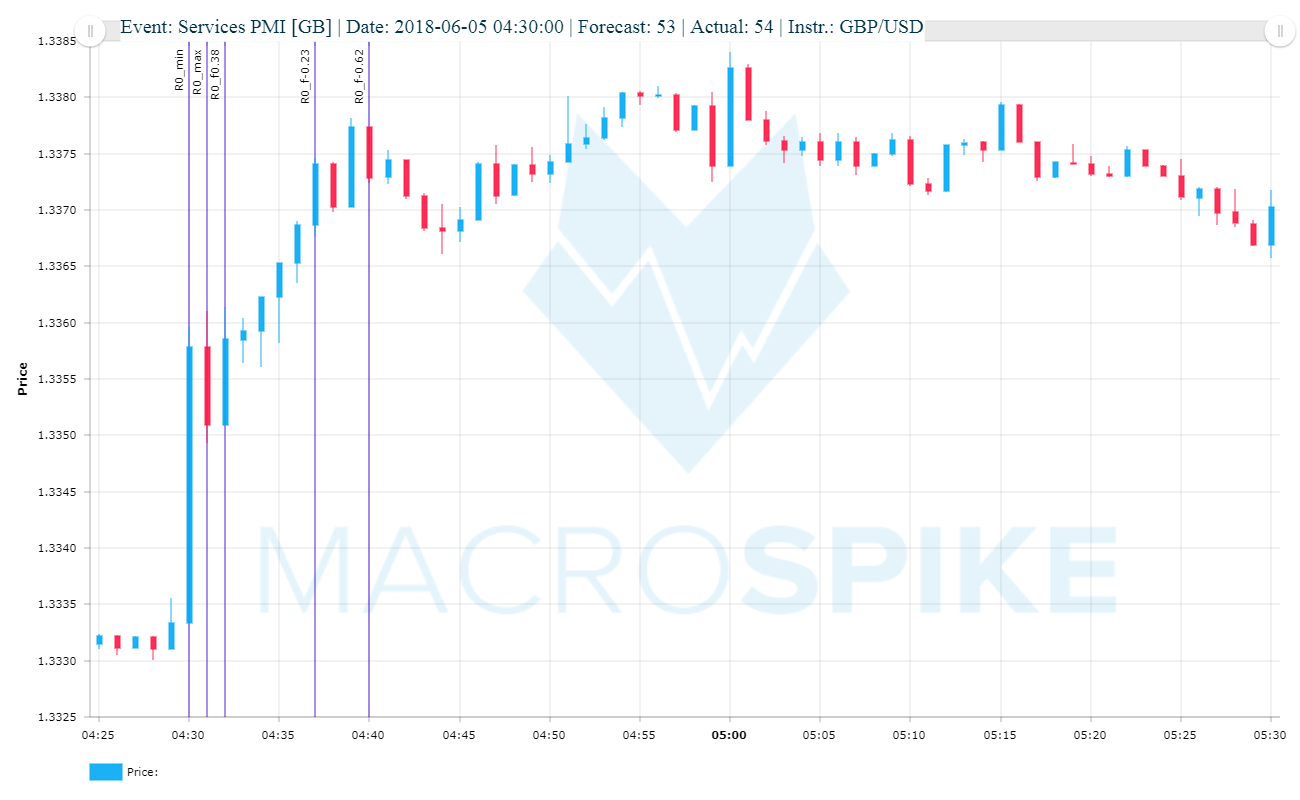
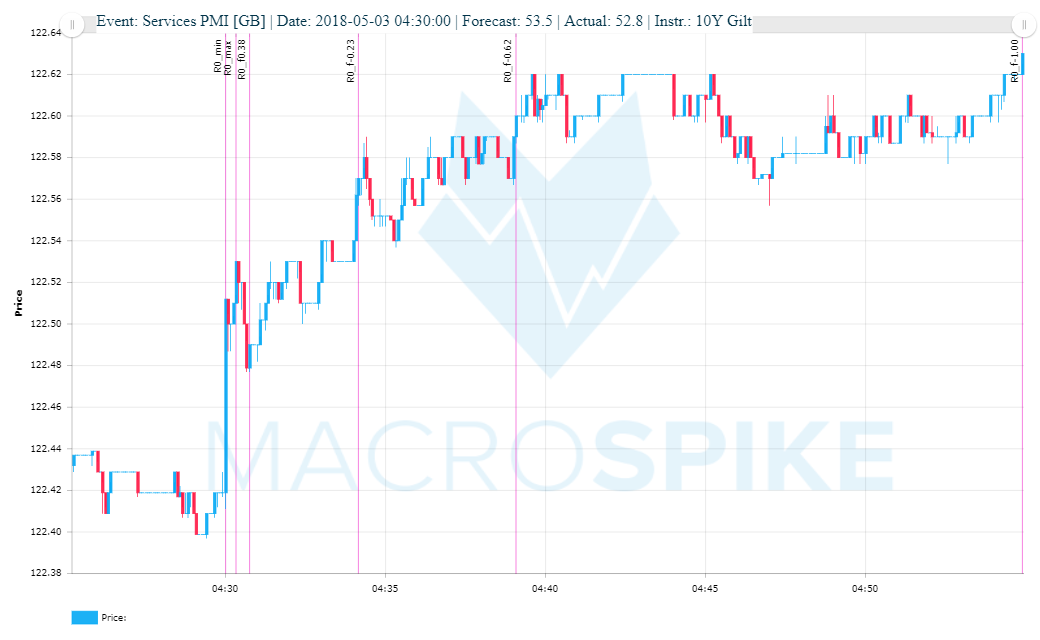
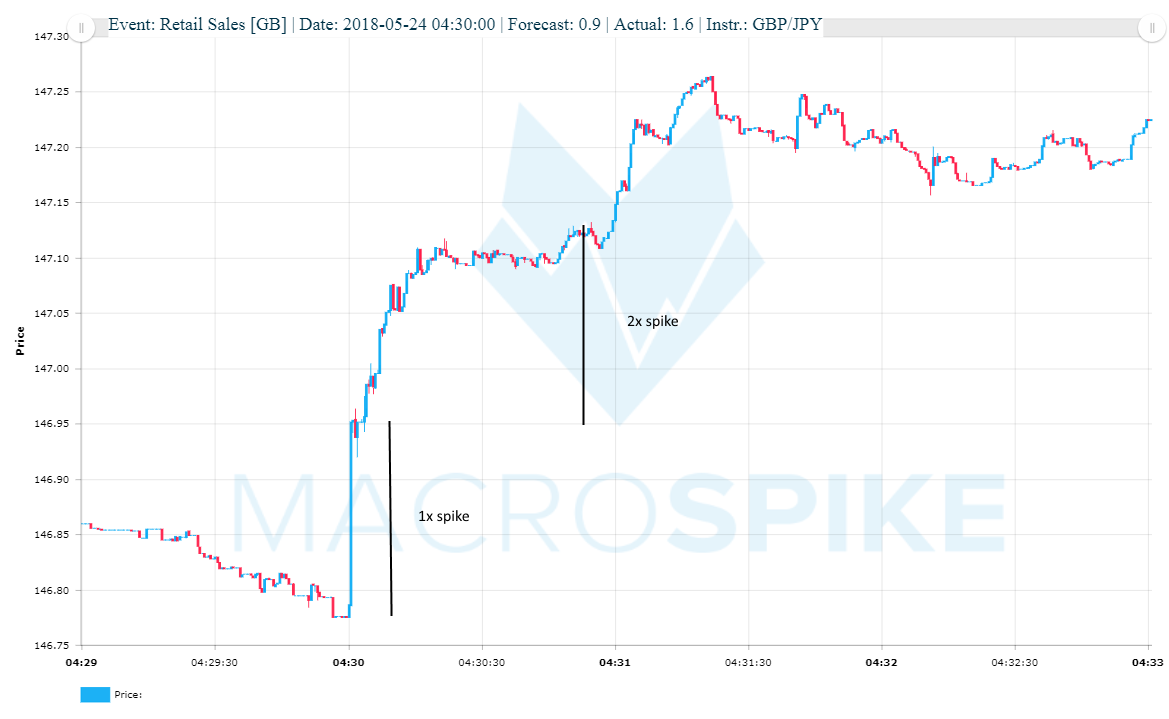
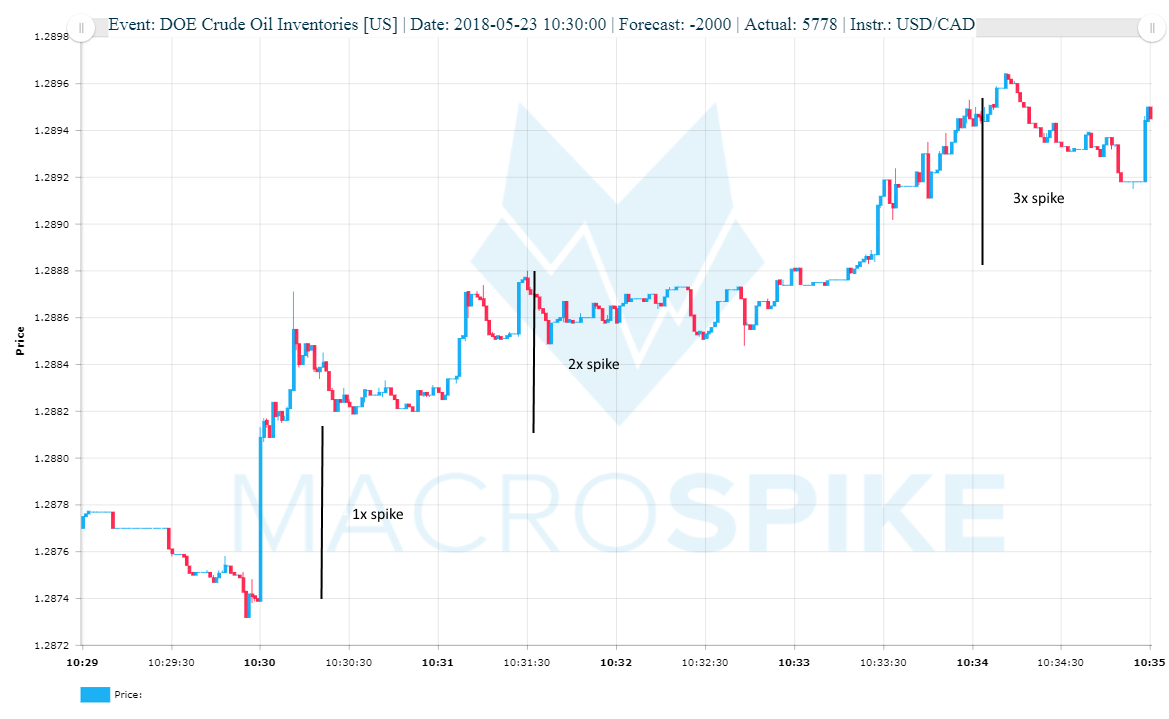
![](/wp-content/uploads/2018/06/764236.png)
![](/wp-content/uploads/2018/06/7642362.png)
The Running Spike
The setup: A sudden and meaningful spike without any big retracement that keeps on running and pushing through support and resistance levels.
![](/wp-content/uploads/2018/06/runningspike.png)
![](/wp-content/uploads/2018/06/runningspike2.png)
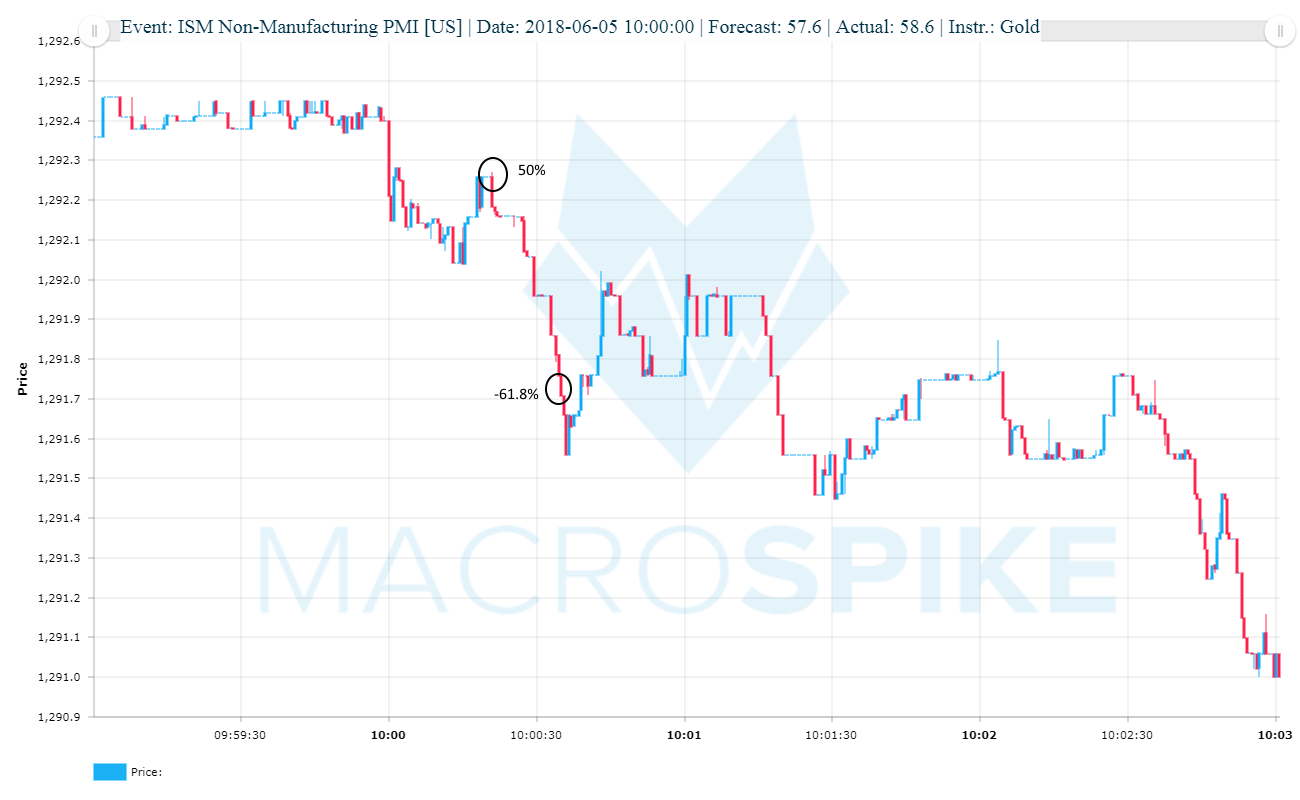
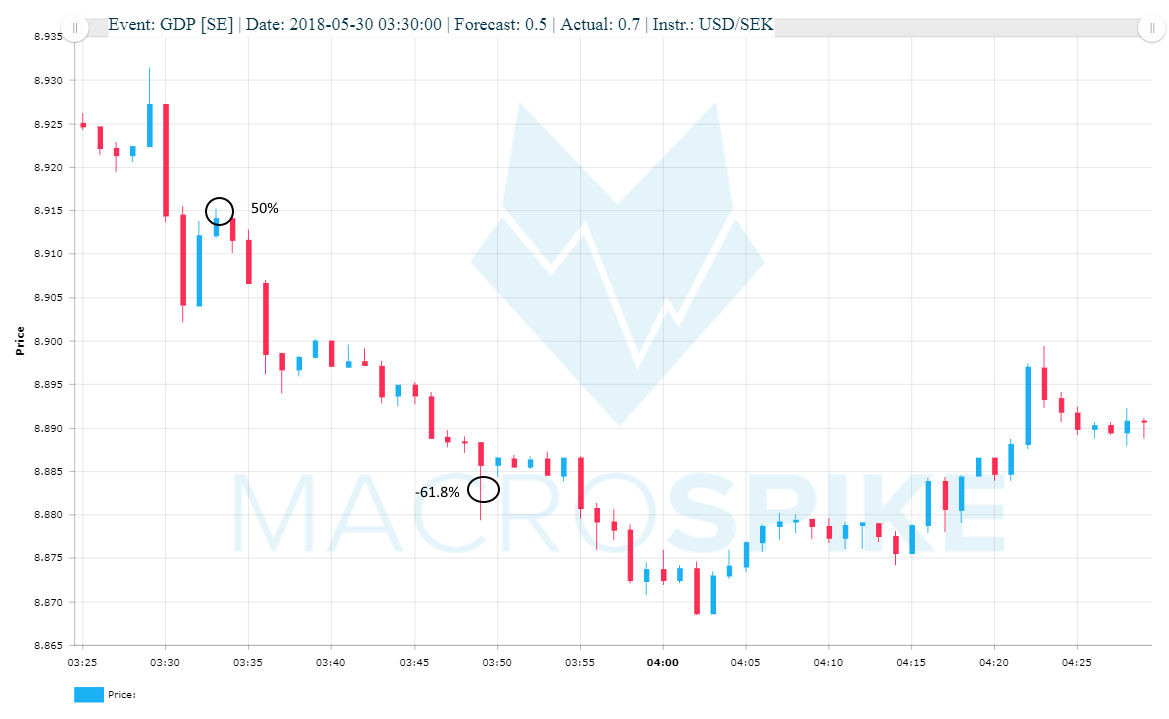
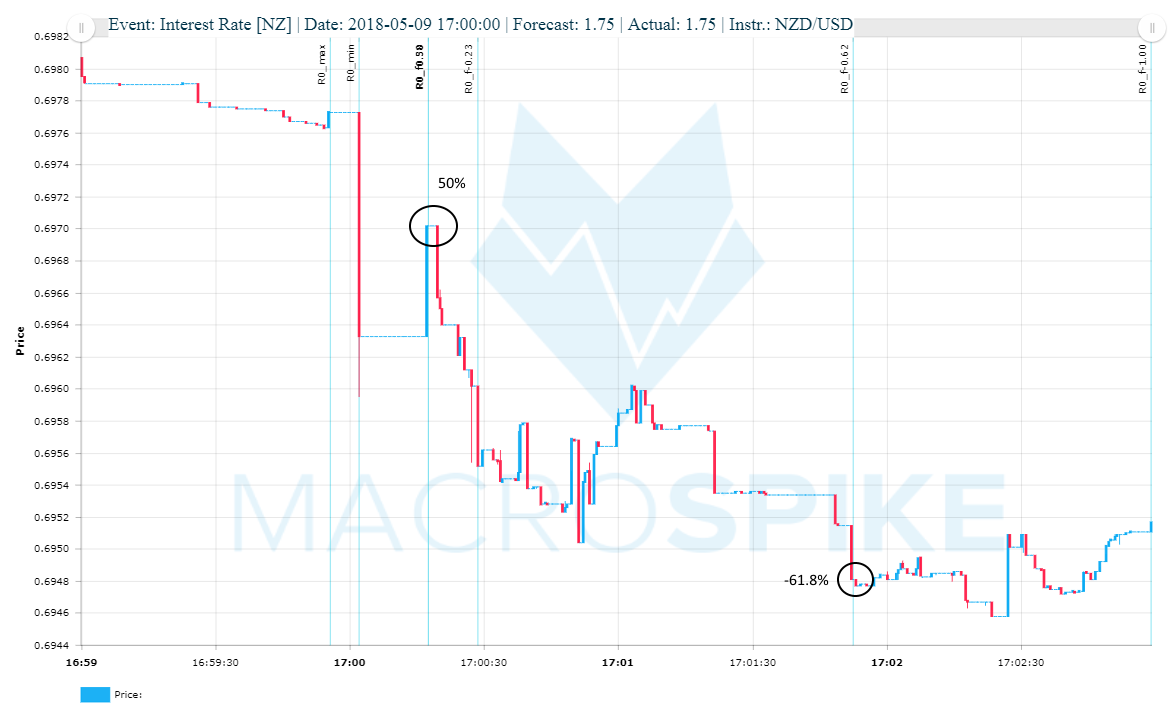
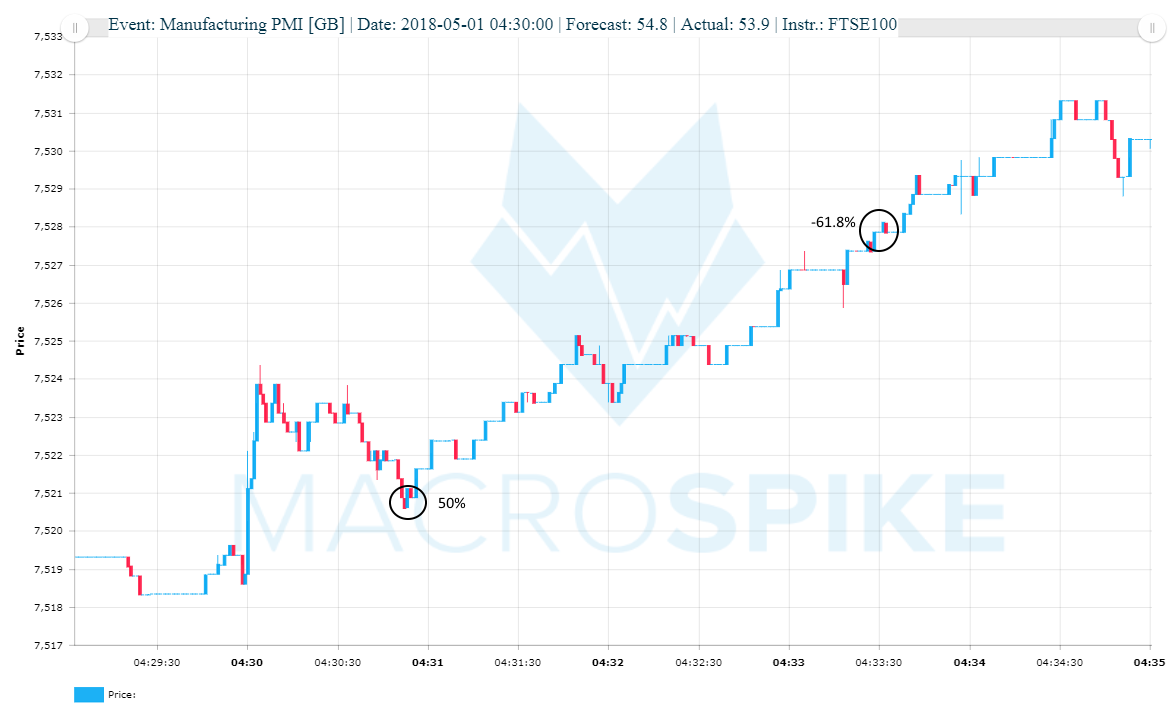
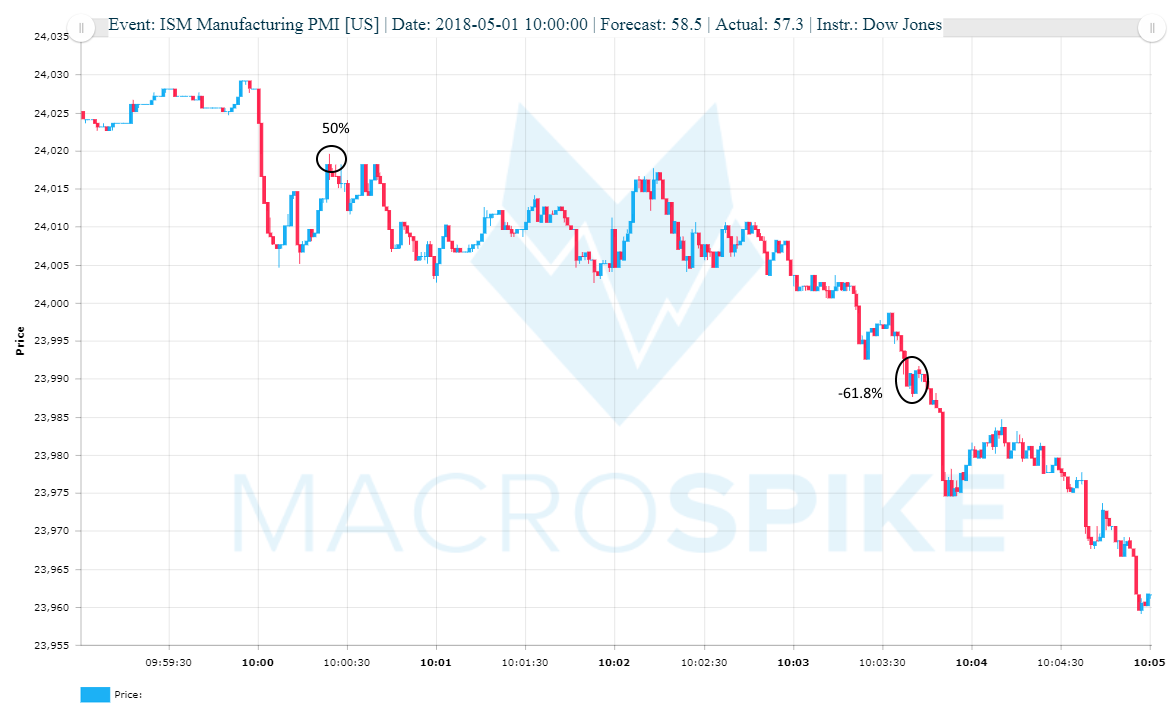
The 50% / -61.8% Spike Continuation Trade
The setup: A news-driven spike retraces 50% from highs/lows, then reaches the -61.8% target.
![](/wp-content/uploads/2018/06/50618.png)
![](/wp-content/uploads/2018/06/2018-06-05_10_00_00_US_ISM_Non-Manufacturing_PMI_Dow_Jones_duka_Dow_Jones_.png)
![](/wp-content/uploads/2018/06/2018-06-05_04_30_00_GB_Services_PMI_FTSE100_duka_FTSE100_.png)
![](/wp-content/uploads/2018/06/506182.png)
![](/wp-content/uploads/2018/06/2018-05-18_08_30_00_CA_CPI_CAD_JPY_duka_CAD_JPY_.png)
![](/wp-content/uploads/2018/06/506183.png)
![](/wp-content/uploads/2018/06/2018-05-01_04_30_00_GB_Manufacturing_PMI_GBP_USD_duka_GBP_USD_.png)
![](/wp-content/uploads/2018/06/506184.png)
![](/wp-content/uploads/2018/06/506185.png)
![](/wp-content/uploads/2018/06/506186.png)
![](/wp-content/uploads/2018/06/2018-05-03_05_00_00_EU_CPI_Estimate_10Y_Bund_oanda_10Y_Bund_.png)