User-generated and historical charts
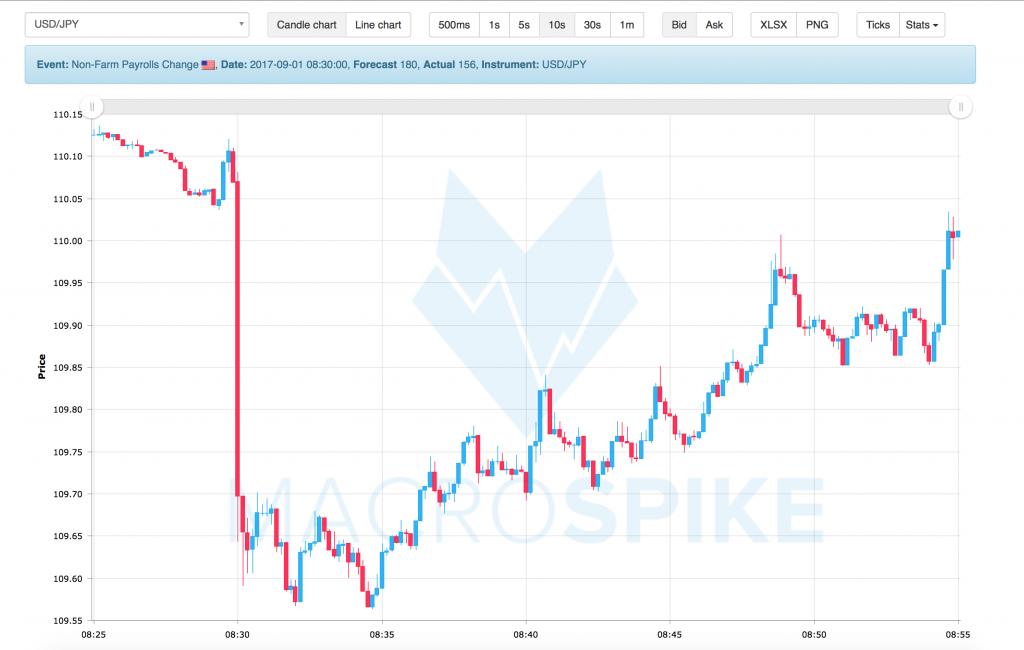
MacroCharts is MacroSpike’s interactive Chart application. It provides you with detailed historical and interactive charts for every event.

There are two chart types:
- Automated Event Charts
- User-generated Charts
Our Chart Platform provides you with historical charts for over 40 different instruments. After every event, you can access them via the calendar or via the Trade Plans. Additionally, you can access our Database of more than 45 000 charts.
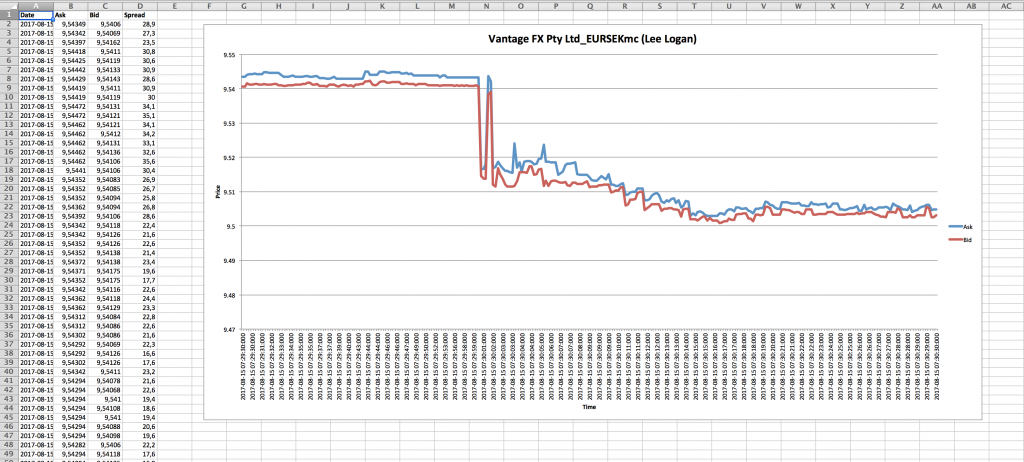
Subscribers of the MacroTrader can generate tick files of the instruments they are trading. Any of the MacroTrader’s EAs can record ticks. This tick file can be uploaded to the MacroCharts app to create custom charts. Simply drag and drop the tick files onto MacroCharts, or click on the ‘Select File for Upload’ Button. The default folder for tick files is C:\Data.
MacroCharts Features
Interactive Chart
The main window displays the chart. The chart is interactive and you can zoom in and out using the mouse wheel. Use ‘Show all’ to reset the chart again.
.png / .xlsx button
Download the chart in .png or .xlsx format to your Hard Drive

Line- /Candle-Chart
You can choose between candlesticks and line charts to display the data. If you choose candles, you can change candle sizes and switch between the bid and ask price. We offer 500ms, 1s, 5s, 10s and 1 min candles.
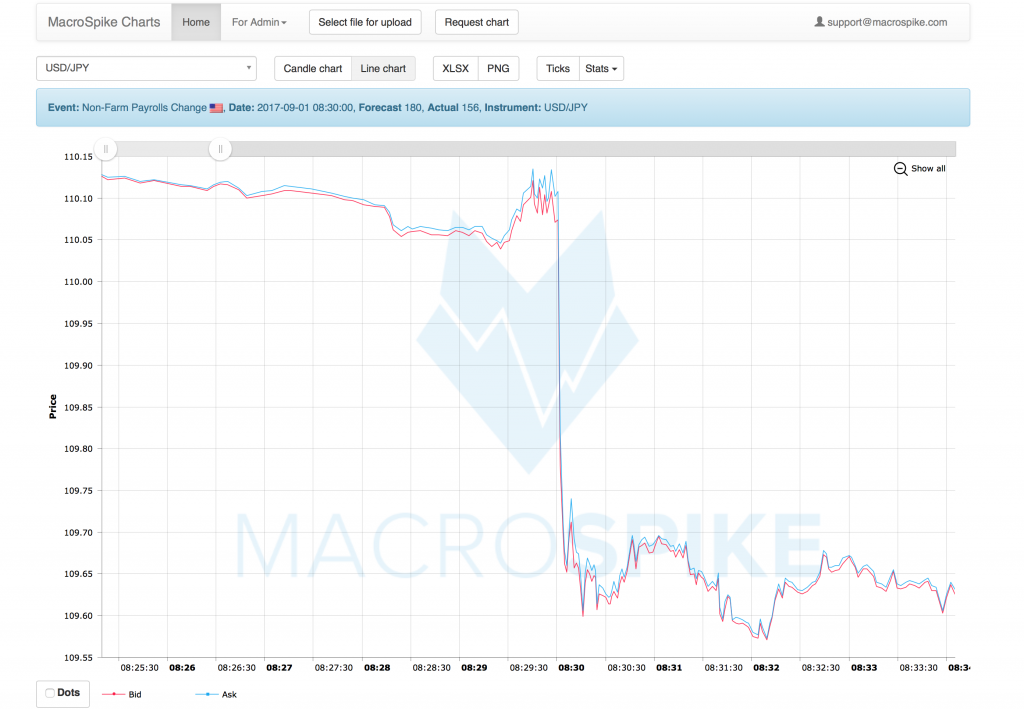
If you choose the line chart, you can see the bid and ask lined up together. On the bottom right, you can disable either the bid or the ask. Or enable price tick dots for the chart. This will highlight every time a tick was received by the MetaTrader.

Tick-window
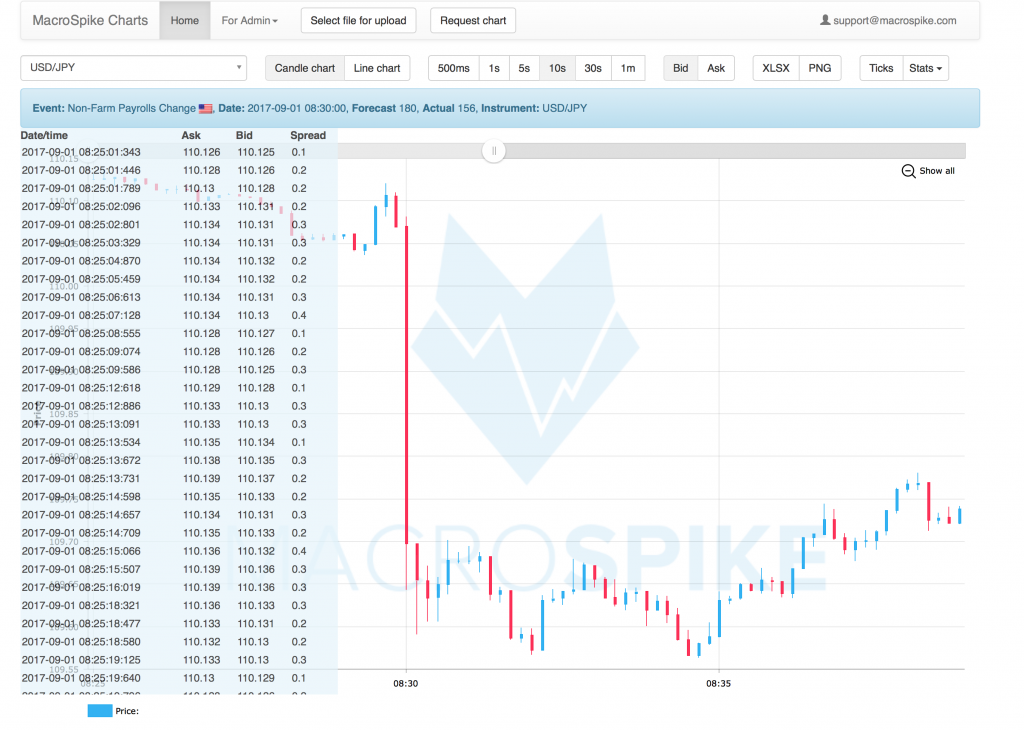
By pressing the tick button, you can open a separate window. This displays a table with all the bid and ask price ticks, their timestamps and spread values.

Stat-Box
The Stat-Box displays additional information about your chart. These statistics can be particularly helpful when you are using a user-generated chart. The statistics with a * indicate that upon hovering over the row, the tick will be highlighted on the chart.
| Min ask | Shows the tick with the lowest ask price on the chart |
| Max ask | Shows the tick with the highest ask price on the chart |
| Min bid | Shows the tick with the lowest bid price on the chart |
| Max bid | Shows the tick with the highest bid price on the chart |
| Count data | Shows the number of ticks the entire chart contains |
| Time delta | Number of seconds the chart covers |
| Ticks/Second | Ticks to Seconds Ratio |
| Avg Spread | Average Spread of all ticks |
| Min Spread | Shows the tick with the lowest spread |
| Max Spread | Shows the tick with the highest spread |
| Standard Deviation | Standard deviation in spread values. Low value means the feed has a very stable feed whereas high value indicates a feed with a lot values deviating from the mean |
| Num Spread | Number of different spread values (required for Standard deviation) |
| Time before event | Shows the last tick before the trading signal was sent out to server (can only be calculated if your tick file’s timezone was set to EST5EDT. Otherwise will show ‘?’) |
| Time after event | Shows the first tick after the trading signal was sent out to server (can only be calculated if your tick file’s timezone was set to EST5EDT. Otherwise will show ‘?’) |
| Spike Size | Number of ticks in the first 5 seconds after the reception of a trading signal (can only be calculated if your tick file’s timezone was set to EST5EDT. Otherwise will show ‘?’) |
| Spike Quality | Spike Size to Max Event Spread Ratio |
| Max Event Spread | Shows tick with the highest spread in the last 2 seconds before and first 3 seconds after the signal was sent out |

